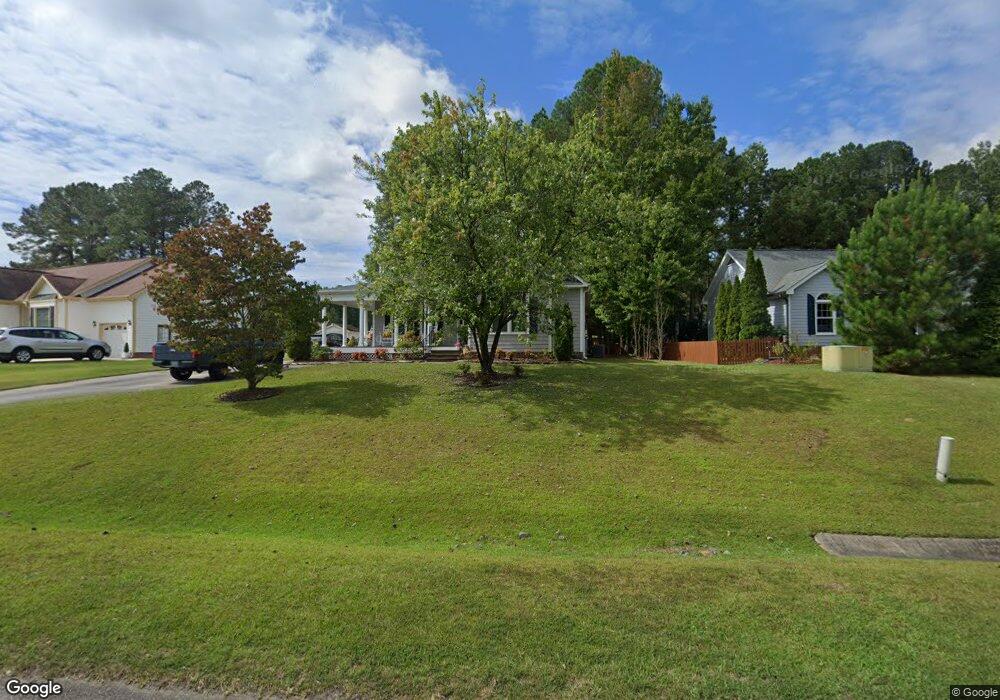
508 Nature Walk Rd Fuquay Varina, NC 27526
Estimated Value: $394,000 - $436,022
3
Beds
2
Baths
1,753
Sq Ft
$234/Sq Ft
Est. Value
About This Home
This home is located at 508 Nature Walk Rd, Fuquay Varina, NC 27526 and is currently estimated at $411,006, approximately $234 per square foot. 508 Nature Walk Rd is a home located in Wake County with nearby schools including Holly Grove Middle School, Fuquay-Varina High, and Achievement Charter Academy.
Ownership History
Date
Name
Owned For
Owner Type
Purchase Details
Closed on
Jan 9, 2002
Sold by
Simmons Claude Eric and Simmons Sheryl
Bought by
Dixon Dale T and Dixon Sandra C
Current Estimated Value
Home Financials for this Owner
Home Financials are based on the most recent Mortgage that was taken out on this home.
Original Mortgage
$105,000
Outstanding Balance
$42,755
Interest Rate
6.99%
Estimated Equity
$368,251
Purchase Details
Closed on
Feb 9, 1999
Sold by
Ces Homes Inc
Bought by
Simmons Claude Eric and Simmons Sheryl Lynne
Home Financials for this Owner
Home Financials are based on the most recent Mortgage that was taken out on this home.
Original Mortgage
$122,160
Interest Rate
6.85%
Purchase Details
Closed on
Oct 16, 1997
Sold by
Windamere Homes Inc
Bought by
Ces Homes Inc
Create a Home Valuation Report for This Property
The Home Valuation Report is an in-depth analysis detailing your home's value as well as a comparison with similar homes in the area
Home Values in the Area
Average Home Value in this Area
Purchase History
| Date | Buyer | Sale Price | Title Company |
|---|---|---|---|
| Dixon Dale T | $168,000 | -- | |
| Simmons Claude Eric | $122,500 | -- | |
| Ces Homes Inc | $28,000 | -- |
Source: Public Records
Mortgage History
| Date | Status | Borrower | Loan Amount |
|---|---|---|---|
| Open | Dixon Dale T | $105,000 | |
| Previous Owner | Simmons Claude Eric | $122,160 |
Source: Public Records
Tax History Compared to Growth
Tax History
| Year | Tax Paid | Tax Assessment Tax Assessment Total Assessment is a certain percentage of the fair market value that is determined by local assessors to be the total taxable value of land and additions on the property. | Land | Improvement |
|---|---|---|---|---|
| 2025 | $3,797 | $431,653 | $100,000 | $331,653 |
| 2024 | $3,782 | $431,653 | $100,000 | $331,653 |
| 2023 | $3,138 | $280,379 | $48,000 | $232,379 |
| 2022 | $2,949 | $280,379 | $48,000 | $232,379 |
| 2021 | $2,810 | $280,379 | $48,000 | $232,379 |
| 2020 | $2,810 | $280,379 | $48,000 | $232,379 |
| 2019 | $2,284 | $196,292 | $44,000 | $152,292 |
| 2018 | $2,153 | $196,292 | $44,000 | $152,292 |
| 2017 | $2,076 | $196,292 | $44,000 | $152,292 |
| 2016 | $0 | $196,292 | $44,000 | $152,292 |
| 2015 | -- | $185,964 | $32,000 | $153,964 |
| 2014 | -- | $185,964 | $32,000 | $153,964 |
Source: Public Records
Map
Nearby Homes
- 716 Parker St
- 637 Stapleford Ln
- 664 Lavenham Ln
- 909 Sunset Dr
- 114 Tweedbank Ct
- 105 Bridge St
- 104 Lawrence St
- 137 Coley Farm Rd
- 610 Silk Tree Trace
- 121 N West St
- 724 Lucky Clover Way
- 722 Lucky Clover Way
- 130 Rusling Leaf Dr
- 720 Lucky Clover Way
- 609 Dorset Stream Dr
- 718 Lucky Clover Way
- 716 Lucky Clover Way
- 509 Timber Meadow Lake Dr
- 605 Dorset Stream Dr
- 714 Lucky Clover Way
- 504 Nature Walk Rd
- 512 Nature Walk Rd
- 500 Nature Walk Rd
- 516 Nature Walk Rd
- 509 Nature Walk Rd
- 613 Moon Shadow Ct
- 904 Sunset Dr
- 505 Nature Walk Rd
- 609 Moon Shadow Ct
- 501 Nature Walk Rd
- 908 Sunset Dr
- 709 Parker St
- 804 Sunset Dr
- 708 Parker St
- 901 Sunset Dr
- 905 Sunset Dr
- 605 Moon Shadow Ct
- 705 Parker St
- 912 Sunset Dr
- 813 Sunset Dr