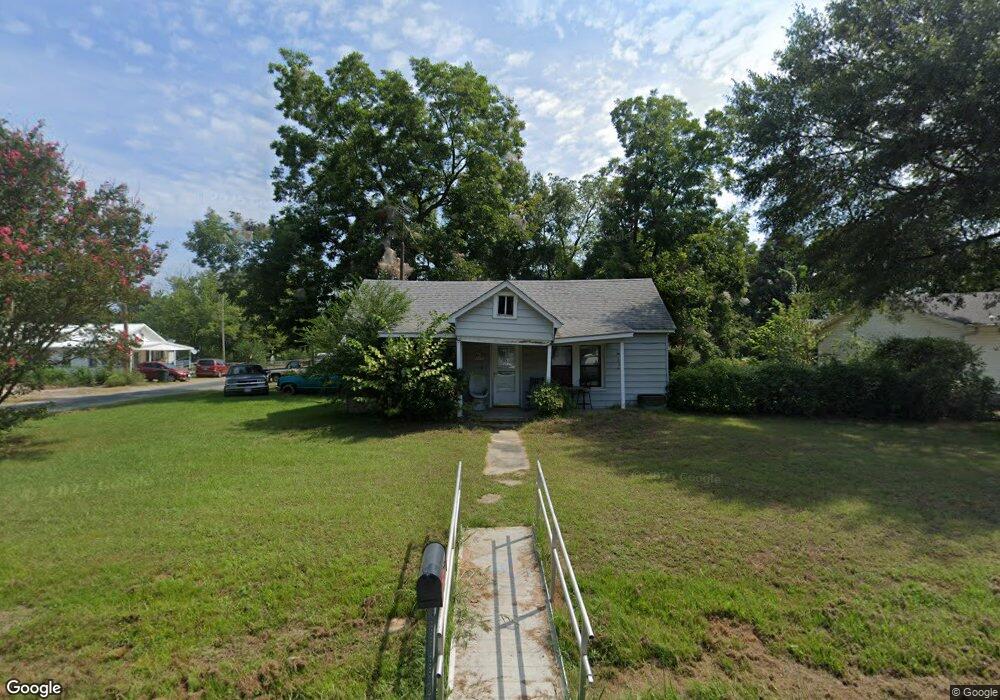
508 NE 5th St Stigler, OK 74462
Estimated Value: $70,150 - $129,000
3
Beds
1
Bath
1,200
Sq Ft
$84/Sq Ft
Est. Value
About This Home
This home is located at 508 NE 5th St, Stigler, OK 74462 and is currently estimated at $100,538, approximately $83 per square foot. 508 NE 5th St is a home located in Haskell County with nearby schools including Stigler Elementary School, Stigler Middle School, and Stigler High School.
Ownership History
Date
Name
Owned For
Owner Type
Purchase Details
Closed on
Aug 22, 2019
Sold by
Beller Sam Robert
Bought by
Matthews Kenneth
Current Estimated Value
Home Financials for this Owner
Home Financials are based on the most recent Mortgage that was taken out on this home.
Original Mortgage
$20,000
Outstanding Balance
$17,478
Interest Rate
3.7%
Mortgage Type
Land Contract Argmt. Of Sale
Estimated Equity
$83,060
Purchase Details
Closed on
Apr 20, 2002
Sold by
John W Hall
Bought by
Sam Robert Beller
Purchase Details
Closed on
Oct 8, 1996
Sold by
Atha M Reid
Bought by
John W Hall
Create a Home Valuation Report for This Property
The Home Valuation Report is an in-depth analysis detailing your home's value as well as a comparison with similar homes in the area
Home Values in the Area
Average Home Value in this Area
Purchase History
| Date | Buyer | Sale Price | Title Company |
|---|---|---|---|
| Matthews Kenneth | -- | None Available | |
| Sam Robert Beller | $25,000 | -- | |
| John W Hall | $35,000 | -- |
Source: Public Records
Mortgage History
| Date | Status | Borrower | Loan Amount |
|---|---|---|---|
| Open | Matthews Kenneth | $20,000 |
Source: Public Records
Tax History Compared to Growth
Tax History
| Year | Tax Paid | Tax Assessment Tax Assessment Total Assessment is a certain percentage of the fair market value that is determined by local assessors to be the total taxable value of land and additions on the property. | Land | Improvement |
|---|---|---|---|---|
| 2025 | $222 | $3,032 | $488 | $2,544 |
| 2024 | $222 | $2,888 | $465 | $2,423 |
| 2023 | $212 | $2,751 | $440 | $2,311 |
| 2022 | $202 | $2,637 | $440 | $2,197 |
| 2021 | $203 | $2,637 | $440 | $2,197 |
| 2020 | $270 | $3,510 | $440 | $3,070 |
| 2019 | $259 | $3,342 | $440 | $2,902 |
| 2018 | $248 | $3,183 | $440 | $2,743 |
| 2017 | $236 | $3,032 | $440 | $2,592 |
| 2016 | $224 | $2,887 | $440 | $2,447 |
| 2015 | $214 | $2,750 | $440 | $2,310 |
| 2014 | $215 | $2,750 | $440 | $2,310 |
Source: Public Records
Map
Nearby Homes
- 902 NE Rushwood Dr
- 203 NE H St
- 0 NE H St
- 315 Ted Allen Ln
- 318 Ted Allen Ln
- 0 S Riverview Unit 2540543
- 0 S Riverview Unit 2540539
- 108 N T 300 St
- 0 Highway 9
- 1103 E Kaniatobe Ln
- 202 NE 9th St
- 201 NW Rose Ln
- 701 NW 3rd St
- 3 NW 3rd St
- 4 NW 3rd St
- 5 NW 3rd St
- 6 NW 3rd St
- 3 NW 4th St
- 2 NW 4th St
- 8 NW 4th St