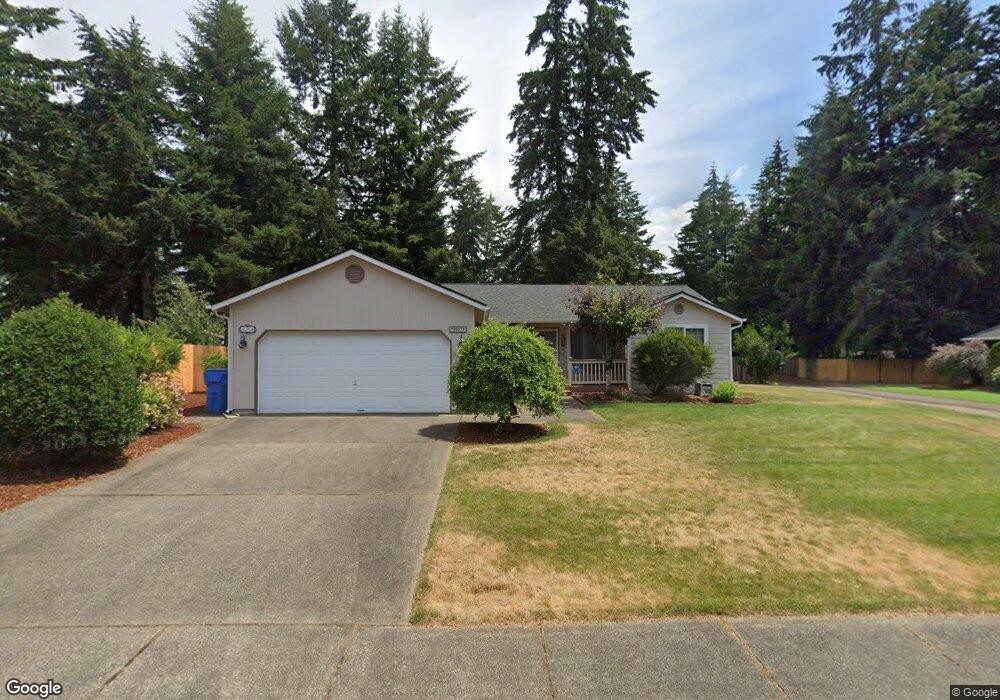
508 Nieland Loop SE Rainier, WA 98576
Estimated Value: $407,000 - $576,000
3
Beds
3
Baths
1,298
Sq Ft
$362/Sq Ft
Est. Value
About This Home
This home is located at 508 Nieland Loop SE, Rainier, WA 98576 and is currently estimated at $469,258, approximately $361 per square foot. 508 Nieland Loop SE is a home located in Thurston County with nearby schools including Rainier Elementary School, Rainier Middle School, and Rainier Senior High School.
Ownership History
Date
Name
Owned For
Owner Type
Purchase Details
Closed on
Sep 13, 1996
Sold by
Rainier General Development Inc
Bought by
Prouty Gary L and Prouty Janet F
Current Estimated Value
Home Financials for this Owner
Home Financials are based on the most recent Mortgage that was taken out on this home.
Original Mortgage
$102,500
Interest Rate
7.88%
Mortgage Type
Balloon
Create a Home Valuation Report for This Property
The Home Valuation Report is an in-depth analysis detailing your home's value as well as a comparison with similar homes in the area
Home Values in the Area
Average Home Value in this Area
Purchase History
| Date | Buyer | Sale Price | Title Company |
|---|---|---|---|
| Prouty Gary L | $113,900 | Transnation Title |
Source: Public Records
Mortgage History
| Date | Status | Borrower | Loan Amount |
|---|---|---|---|
| Closed | Prouty Gary L | $102,500 |
Source: Public Records
Tax History
| Year | Tax Paid | Tax Assessment Tax Assessment Total Assessment is a certain percentage of the fair market value that is determined by local assessors to be the total taxable value of land and additions on the property. | Land | Improvement |
|---|---|---|---|---|
| 2025 | $3,587 | $407,200 | $117,100 | $290,100 |
| 2024 | $3,587 | $398,900 | $108,700 | $290,200 |
| 2023 | $3,587 | $382,300 | $100,600 | $281,700 |
| 2022 | $3,297 | $378,200 | $77,000 | $301,200 |
| 2021 | $2,742 | $319,400 | $65,400 | $254,000 |
| 2020 | $2,708 | $261,200 | $59,700 | $201,500 |
| 2019 | $2,475 | $233,800 | $49,700 | $184,100 |
| 2018 | $2,737 | $216,600 | $44,600 | $172,000 |
| 2017 | $2,465 | $201,850 | $40,050 | $161,800 |
| 2016 | $2,445 | $186,900 | $44,900 | $142,000 |
| 2014 | -- | $184,500 | $44,900 | $139,600 |
Source: Public Records
Map
Nearby Homes
- 604 Nieland Loop SE
- 605 Hubbard Rd SE
- 302 Centre St N
- 108 Centre St S
- 108 2nd St SE
- 309 Binghampton St SE
- 308 Easy St SE
- 733 Tipsoo Loop S
- 414 Easy St SE
- 210 Country Estates Dr W
- 955 Tipsoo Loop N
- 101 Murphy Ln S
- 701 Myers St SE
- 810 Cody St SE
- 132 xx Algyer Rd SE
- 823 Tipsoo Loop S
- 9912 138th Ave SE
- 14403 Brandie Ct SE
- 8744 Colony Ln SE
- 14319 123rd Ave SE
- 510 Nieland Loop SE
- 506 Nieland Loop SE
- 509 Nieland Loop SE
- 504 Nieland Loop SE
- 511 Nieland Loop SE
- 512 Nieland Loop SE
- 136 Raintree Loop SE
- 140 134th Ct SE
- 502 Nieland Loop SE
- 301 135th Place SE
- 303 135th Place SE
- 602 Nieland Loop SE
- 138 Raintree Loop SE
- 514 Nieland Loop SE
- 304 133rd Ave SE
- 104 Raintree Loop SE
- 513 Nieland Loop SE
- 306 133rd Ave SE
- 106 Raintree Loop SE
- 500 Nieland Loop SE
Your Personal Tour Guide
Ask me questions while you tour the home.