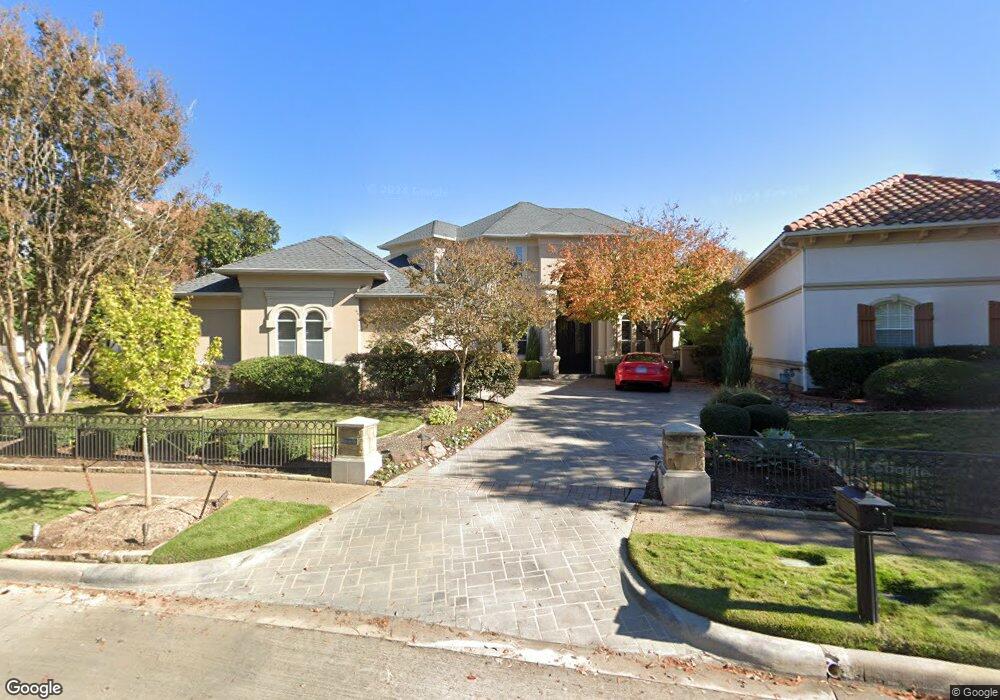
508 Queensbury Turn Southlake, TX 76092
Estimated Value: $1,417,000 - $1,720,000
4
Beds
4
Baths
4,441
Sq Ft
$350/Sq Ft
Est. Value
About This Home
This home is located at 508 Queensbury Turn, Southlake, TX 76092 and is currently estimated at $1,552,330, approximately $349 per square foot. 508 Queensbury Turn is a home located in Tarrant County with nearby schools including Old Union Elementary School, Eubanks Intermediate School, and George Dawson Middle School.
Ownership History
Date
Name
Owned For
Owner Type
Purchase Details
Closed on
Mar 1, 2005
Sold by
Ahern Timothy J and Ahern Leonor S
Bought by
Murray Michael and Murray Miriam
Current Estimated Value
Home Financials for this Owner
Home Financials are based on the most recent Mortgage that was taken out on this home.
Original Mortgage
$560,000
Outstanding Balance
$285,784
Interest Rate
5.71%
Mortgage Type
Purchase Money Mortgage
Estimated Equity
$1,266,546
Purchase Details
Closed on
Aug 15, 1997
Sold by
Sobeco Llc
Bought by
Ahern Timothy J and Ahern Leonor S
Home Financials for this Owner
Home Financials are based on the most recent Mortgage that was taken out on this home.
Original Mortgage
$118,170
Interest Rate
9.75%
Create a Home Valuation Report for This Property
The Home Valuation Report is an in-depth analysis detailing your home's value as well as a comparison with similar homes in the area
Home Values in the Area
Average Home Value in this Area
Purchase History
| Date | Buyer | Sale Price | Title Company |
|---|---|---|---|
| Murray Michael | -- | -- | |
| Ahern Timothy J | -- | American Title Co |
Source: Public Records
Mortgage History
| Date | Status | Borrower | Loan Amount |
|---|---|---|---|
| Open | Murray Michael | $560,000 | |
| Previous Owner | Ahern Timothy J | $118,170 |
Source: Public Records
Tax History Compared to Growth
Tax History
| Year | Tax Paid | Tax Assessment Tax Assessment Total Assessment is a certain percentage of the fair market value that is determined by local assessors to be the total taxable value of land and additions on the property. | Land | Improvement |
|---|---|---|---|---|
| 2025 | $22,965 | $1,313,064 | $250,000 | $1,063,064 |
| 2024 | $22,965 | $1,313,064 | $250,000 | $1,063,064 |
| 2023 | $25,400 | $1,393,546 | $250,000 | $1,143,546 |
| 2022 | $23,770 | $1,101,805 | $175,000 | $926,805 |
| 2021 | $21,718 | $952,565 | $175,000 | $777,565 |
| 2020 | $21,980 | $956,225 | $175,000 | $781,225 |
| 2019 | $20,244 | $836,000 | $210,000 | $626,000 |
| 2018 | $20,244 | $836,000 | $262,500 | $573,500 |
| 2017 | $21,831 | $880,785 | $245,000 | $635,785 |
| 2016 | $20,646 | $832,941 | $262,500 | $570,441 |
| 2015 | $19,033 | $882,635 | $187,500 | $695,135 |
| 2014 | $19,033 | $760,300 | $87,500 | $672,800 |
Source: Public Records
Map
Nearby Homes
- 521 Regency Crossing
- 1420 Kensington Ct
- 608 Regency Crossing
- 7208 Stilton Ct
- 7322 Calloway Ct
- 7316 Calloway Ct
- 1417 Nottoway Ct
- 1418 Nottoway Ct
- 1406 Nottoway Ct
- 1719 Byron Nelson Pkwy
- 7106 Belle Meade Dr
- 1227 Strathmore Dr
- 7200 Belle Meade Dr
- 7001 Colleyville Blvd
- 7255 Oak Alley Dr
- 710 Longford Dr
- 7312 Hix Ct
- 7012 Shepherds Glen
- 2406 Wilkes Dr
- 1401 Chardonnay Ct
- 506 Queensbury Turn
- 510 Queensbury Turn
- 504 Queensbury Turn
- 512 Queensbury Turn
- 502 Regency Crossing
- 514 Queensbury Turn
- 516 Queensbury Turn
- 505 Regency Crossing
- 507 Regency Crossing
- 503 Regency Crossing
- 509 Regency Crossing
- 518 Queensbury Turn
- 501 Regency Crossing
- 511 Regency Crossing
- 513 Regency Crossing
- 520 Queensbury Turn
- 515 Regency Crossing
- 522 Queensbury Turn
- 517 Regency Crossing
- 519 Regency Crossing