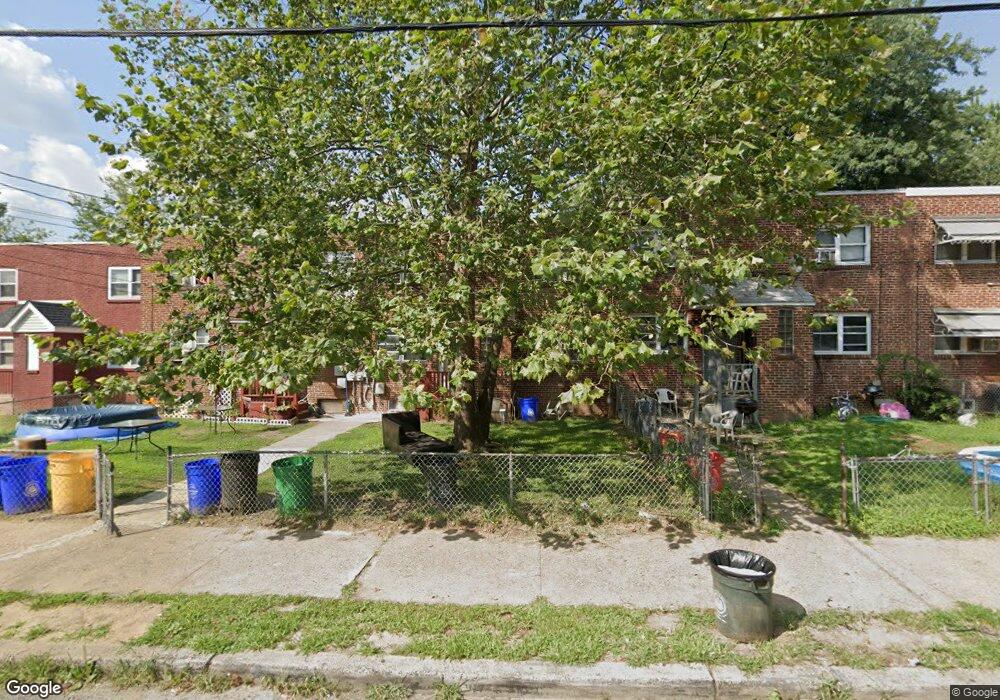
508 Rand St Camden, NJ 08105
Marlton NeighborhoodEstimated Value: $150,107 - $195,000
--
Bed
--
Bath
1,404
Sq Ft
$123/Sq Ft
Est. Value
About This Home
This home is located at 508 Rand St, Camden, NJ 08105 and is currently estimated at $173,027, approximately $123 per square foot. 508 Rand St is a home located in Camden County with nearby schools including Alfred Cramer College Preparatory Lab School, Eastside High School, and St Joseph Pro-Cathedral School.
Ownership History
Date
Name
Owned For
Owner Type
Purchase Details
Closed on
Nov 14, 2022
Sold by
Ferguson Katherine
Bought by
506-516 Rand St Llc
Current Estimated Value
Home Financials for this Owner
Home Financials are based on the most recent Mortgage that was taken out on this home.
Original Mortgage
$470,000
Interest Rate
6.33%
Mortgage Type
Construction
Purchase Details
Closed on
Apr 2, 1985
Bought by
Ferguson Vernon L and Ferguson Ferguson
Create a Home Valuation Report for This Property
The Home Valuation Report is an in-depth analysis detailing your home's value as well as a comparison with similar homes in the area
Home Values in the Area
Average Home Value in this Area
Purchase History
| Date | Buyer | Sale Price | Title Company |
|---|---|---|---|
| 506-516 Rand St Llc | $100,000 | Fidelity National Title | |
| Ferguson Vernon L | $7,800 | -- |
Source: Public Records
Mortgage History
| Date | Status | Borrower | Loan Amount |
|---|---|---|---|
| Previous Owner | 506-516 Rand St Llc | $470,000 | |
| Closed | 506-516 Rand St Llc | $60,000 |
Source: Public Records
Tax History Compared to Growth
Tax History
| Year | Tax Paid | Tax Assessment Tax Assessment Total Assessment is a certain percentage of the fair market value that is determined by local assessors to be the total taxable value of land and additions on the property. | Land | Improvement |
|---|---|---|---|---|
| 2025 | $2,562 | $72,300 | $19,900 | $52,400 |
| 2024 | $2,476 | $72,300 | $19,900 | $52,400 |
| 2023 | $2,476 | $72,300 | $19,900 | $52,400 |
| 2022 | $2,430 | $72,300 | $19,900 | $52,400 |
| 2021 | $2,421 | $72,300 | $19,900 | $52,400 |
| 2020 | $2,299 | $72,300 | $19,900 | $52,400 |
| 2019 | $2,202 | $72,300 | $19,900 | $52,400 |
| 2018 | $2,190 | $72,300 | $19,900 | $52,400 |
| 2017 | $2,136 | $72,300 | $19,900 | $52,400 |
| 2016 | $2,069 | $72,300 | $19,900 | $52,400 |
| 2015 | $1,991 | $72,300 | $19,900 | $52,400 |
| 2014 | $1,943 | $72,300 | $19,900 | $52,400 |
Source: Public Records
Map
Nearby Homes
- 549 Pfeiffer St
- 477 Rand St
- 608 Raritan St
- 420 Boyd St
- 578 Raritan St
- 603 Raritan St
- 506 Pfeiffer St
- 7130 Rosemont Ave
- 444 Pfeiffer St
- 532 Randolph St
- 355 S 27th St
- 7186 Waldorf Ave
- 6804 Waldorf Ave
- 6861 Clark Ave
- 2931 Royden St
- 2933 Royden St
- 154 Eutaw Ave
- 2598 Baird Blvd
- 331 Garden Ave
- 2621 Westfield Ave