508 Rice St Springfield, OH 45505
Estimated Value: $94,000 - $146,000
About This Home
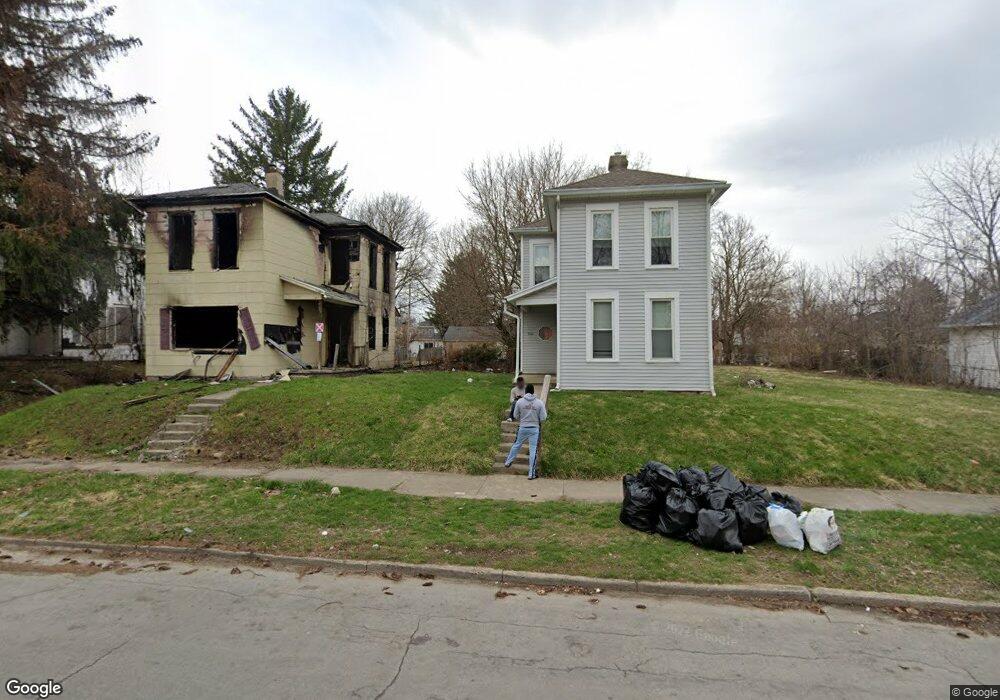
This home is located at 508 Rice St, Springfield, OH 45505 and is currently estimated at $121,477, approximately $106 per square foot. 508 Rice St is a home located in Clark County with nearby schools including Lincoln Elementary School, Hayward Middle School, and Springfield High School.
Ownership History
We collect this data history from publicly available records. To have your information removed, we recommend requesting removal directly through your county’s website.
Purchase Details
Purchase Details
Purchase Details
Purchase Details
Home Financials for this Owner
Home Financials are based on the most recent Mortgage that was taken out on this home.Purchase Details
Home Values in the Area
Average Home Value in this Area
Purchase History
We collect this data history from publicly available records. To have your information removed, we recommend requesting removal directly through your county’s website.
| Date | Buyer | Sale Price | Title Company |
|---|---|---|---|
| -- | -- | ||
| $15,800 | -- | ||
| $23,400 | -- | ||
| $59,000 | Nations Title Agency Of Ohio | ||
| $65,000 | -- |
Mortgage History
We collect this data history from publicly available records. To have your information removed, we recommend requesting removal directly through your county’s website.
| Date | Status | Borrower | Loan Amount |
|---|---|---|---|
| Previous Owner | $50,800 |
Tax History
We collect this data history from publicly available records. To have your information removed, we recommend requesting removal directly through your county’s website.
| Year | Tax Paid | Tax Assessment Tax Assessment Total Assessment is a certain percentage of the fair market value that is determined by local assessors to be the total taxable value of land and additions on the property. | Land | Improvement |
|---|---|---|---|---|
| 2025 | $233 | $680 | $680 | -- |
| 2024 | $14,566 | $930 | $930 | -- |
| 2023 | $8,319 | $930 | $930 | $0 |
| 2022 | $6,815 | $7,440 | $930 | $6,510 |
| 2021 | $346 | $6,300 | $770 | $5,530 |
| 2020 | $347 | $6,300 | $770 | $5,530 |
| 2019 | $348 | $6,300 | $770 | $5,530 |
| 2018 | $453 | $7,880 | $810 | $7,070 |
| 2017 | $453 | $7,875 | $805 | $7,070 |
| 2016 | $454 | $7,875 | $805 | $7,070 |
| 2015 | $448 | $7,637 | $805 | $6,832 |
| 2014 | $446 | $7,637 | $805 | $6,832 |
| 2013 | $442 | $7,637 | $805 | $6,832 |
Map
- 501 E Southern Ave
- 550 E Rose St
- 1322 Linden Ave
- 441 E Euclid Ave
- 1008 Tibbetts Ave
- 205 E Grand Ave
- 1417 Clifton Ave Unit 1419
- 1724 Clay St
- 1018 Cypress St
- 122 Prairie Ave
- 705 York St
- 0 W Perrin Ave Unit 1043508
- 0 W Perrin Ave Unit 951292
- 625 Tibbetts Ave
- 907-913 S Limestone St
- 1355 S Fountain Ave
- 1846 Ohio Ave
- 1027 Lafayette Ave
- 1619 S Center Blvd
- 453 E Pleasant St
Ask me questions while you tour the home.