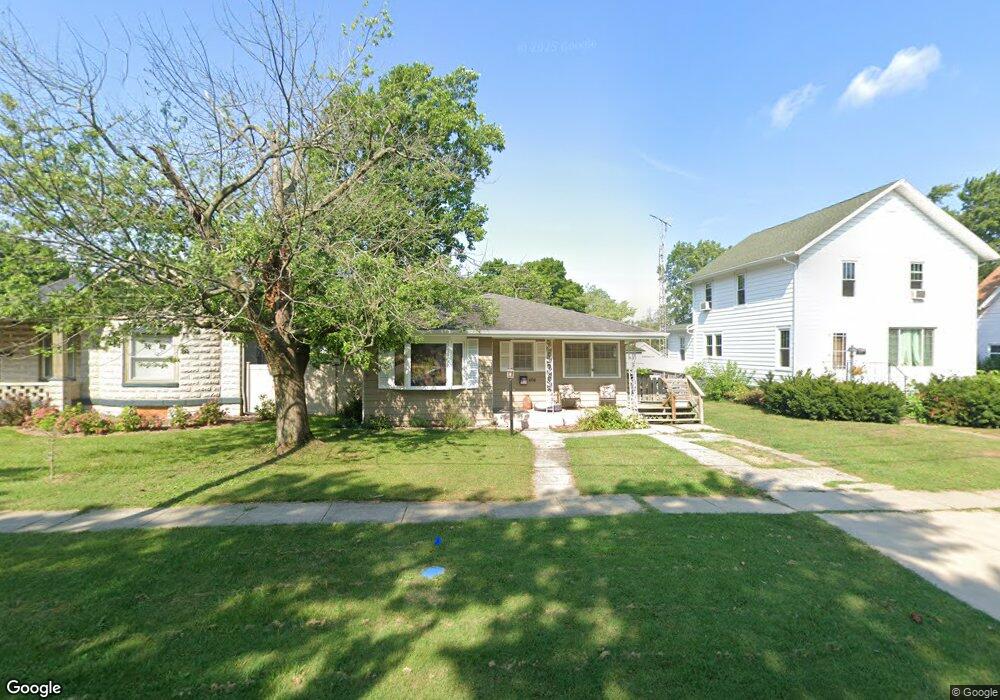
508 S Elm St Three Oaks, MI 49128
Estimated Value: $227,343 - $305,000
2
Beds
1
Bath
905
Sq Ft
$295/Sq Ft
Est. Value
About This Home
This home is located at 508 S Elm St, Three Oaks, MI 49128 and is currently estimated at $266,836, approximately $294 per square foot. 508 S Elm St is a home located in Berrien County with nearby schools including River Valley Middle/High School and Lutie High School.
Ownership History
Date
Name
Owned For
Owner Type
Purchase Details
Closed on
Aug 22, 2016
Sold by
Covert Pamela R and Vanergrift Raymond B
Bought by
Covert Pamela R
Current Estimated Value
Purchase Details
Closed on
Oct 20, 2005
Sold by
Covert Pamela R
Bought by
Covert Pamela R and Vandergrift Raymond B
Purchase Details
Closed on
Jul 26, 2005
Sold by
Varda Eleanor S
Bought by
Covert Pamela R
Home Financials for this Owner
Home Financials are based on the most recent Mortgage that was taken out on this home.
Original Mortgage
$72,000
Outstanding Balance
$38,645
Interest Rate
6%
Mortgage Type
Fannie Mae Freddie Mac
Estimated Equity
$228,191
Purchase Details
Closed on
Mar 12, 1993
Create a Home Valuation Report for This Property
The Home Valuation Report is an in-depth analysis detailing your home's value as well as a comparison with similar homes in the area
Home Values in the Area
Average Home Value in this Area
Purchase History
| Date | Buyer | Sale Price | Title Company |
|---|---|---|---|
| Covert Pamela R | -- | Attorney | |
| Covert Pamela R | -- | None Available | |
| Covert Pamela R | -- | -- | |
| -- | -- | -- |
Source: Public Records
Mortgage History
| Date | Status | Borrower | Loan Amount |
|---|---|---|---|
| Open | Covert Pamela R | $72,000 |
Source: Public Records
Tax History Compared to Growth
Tax History
| Year | Tax Paid | Tax Assessment Tax Assessment Total Assessment is a certain percentage of the fair market value that is determined by local assessors to be the total taxable value of land and additions on the property. | Land | Improvement |
|---|---|---|---|---|
| 2025 | $1,545 | $91,200 | $0 | $0 |
| 2024 | $1,027 | $82,900 | $0 | $0 |
| 2023 | $977 | $84,600 | $0 | $0 |
| 2022 | $940 | $67,500 | $0 | $0 |
| 2021 | $1,927 | $61,300 | $8,600 | $52,700 |
| 2020 | $1,839 | $46,300 | $0 | $0 |
| 2019 | $1,764 | $36,300 | $6,000 | $30,300 |
| 2018 | $1,246 | $36,300 | $0 | $0 |
| 2017 | $1,693 | $36,538 | $0 | $0 |
| 2016 | $1,098 | $31,719 | $0 | $0 |
| 2015 | $1,096 | $31,426 | $0 | $0 |
| 2014 | $323 | $29,720 | $0 | $0 |
Source: Public Records
Map
Nearby Homes