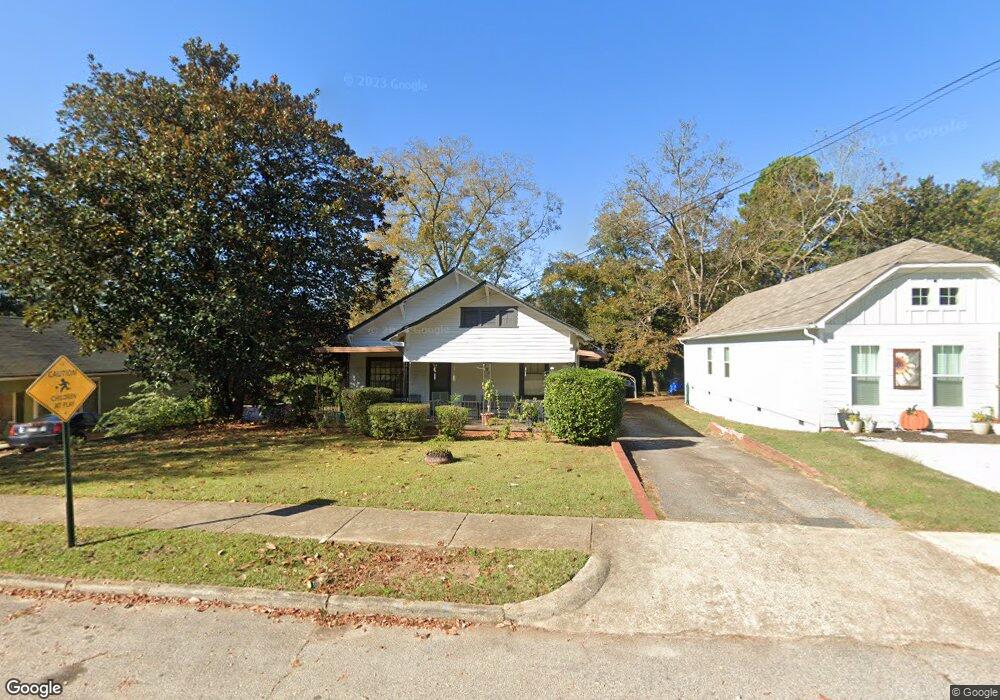
508 S Lee St Lagrange, GA 30240
Estimated Value: $120,574 - $171,000
3
Beds
2
Baths
1,604
Sq Ft
$92/Sq Ft
Est. Value
About This Home
This home is located at 508 S Lee St, Lagrange, GA 30240 and is currently estimated at $147,144, approximately $91 per square foot. 508 S Lee St is a home located in Troup County with nearby schools including Ethel W. Kight Elementary School, Hollis Hand Elementary School, and Franklin Forest Elementary School.
Ownership History
Date
Name
Owned For
Owner Type
Purchase Details
Closed on
Sep 7, 2021
Sold by
Selbie David
Bought by
Tbw Investments Llc
Current Estimated Value
Purchase Details
Closed on
Jan 22, 2008
Sold by
Selbie Frederick D
Bought by
Selbie David
Purchase Details
Closed on
Jul 14, 1979
Sold by
Bailey Clarence David
Bought by
Selbie Frederick D
Purchase Details
Closed on
Nov 7, 1977
Sold by
Traylor Mildred
Bought by
Bailey Clarence David
Purchase Details
Closed on
Jun 24, 1975
Sold by
Traylor Emmett E
Bought by
Traylor Mildred
Purchase Details
Closed on
Jan 1, 1952
Sold by
Callaway Community Fdn
Bought by
Traylor Emmett E
Create a Home Valuation Report for This Property
The Home Valuation Report is an in-depth analysis detailing your home's value as well as a comparison with similar homes in the area
Purchase History
| Date | Buyer | Sale Price | Title Company |
|---|---|---|---|
| Tbw Investments Llc | $148,260 | -- | |
| Selbie David | $190,000 | -- | |
| Selbie David | $190,000 | -- | |
| Selbie Frederick D | $28,500 | -- | |
| Bailey Clarence David | $28,000 | -- | |
| Traylor Mildred | -- | -- | |
| Traylor Emmett E | -- | -- |
Source: Public Records
Tax History
| Year | Tax Paid | Tax Assessment Tax Assessment Total Assessment is a certain percentage of the fair market value that is determined by local assessors to be the total taxable value of land and additions on the property. | Land | Improvement |
|---|---|---|---|---|
| 2025 | $944 | $47,036 | $3,040 | $43,996 |
| 2024 | $944 | $34,596 | $3,040 | $31,556 |
| 2023 | $865 | $31,716 | $3,040 | $28,676 |
| 2022 | $497 | $28,596 | $3,040 | $25,556 |
| 2021 | $658 | $21,808 | $3,040 | $18,768 |
| 2020 | $658 | $21,808 | $3,040 | $18,768 |
| 2019 | $610 | $20,236 | $3,040 | $17,196 |
| 2018 | $590 | $19,556 | $3,000 | $16,556 |
| 2017 | $590 | $19,556 | $3,000 | $16,556 |
| 2016 | $582 | $19,311 | $3,000 | $16,311 |
| 2015 | $586 | $19,383 | $3,072 | $16,311 |
| 2014 | $520 | $18,525 | $3,072 | $15,453 |
| 2013 | -- | $23,958 | $3,068 | $20,890 |
Source: Public Records
Map
Nearby Homes
- 507 S Lee St
- 503 S Lee St
- 517 Jefferson St
- 133 Garfield St
- 202 Parker Ln
- 211 Moores Hill
- 0 Moores Hill
- 109 Garfield St
- 107 Clark St
- 610 Wilburn Ave
- 608 Wilburn Ave
- 1518 Brownwood Ave
- 0 N Lee St Unit 10550825
- 217 Jefferson St
- 812 Elm St
- 600 Park Ave
- 1304 Forrest Ave
- 1405 Forrest Ave
- 1402 Forrest Ave
- 102 Crown St Unit LOT 1
Your Personal Tour Guide
Ask me questions while you tour the home.