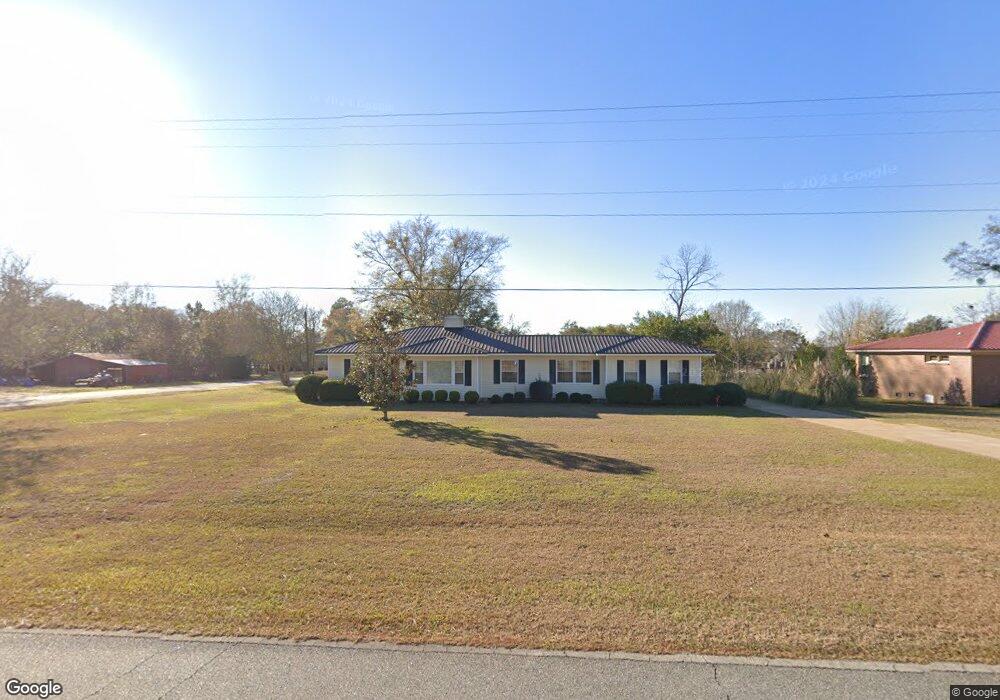
508 S Newcombe Ave Donalsonville, GA 39845
Estimated Value: $167,158 - $185,000
--
Bed
2
Baths
1,871
Sq Ft
$94/Sq Ft
Est. Value
About This Home
This home is located at 508 S Newcombe Ave, Donalsonville, GA 39845 and is currently estimated at $176,040, approximately $94 per square foot. 508 S Newcombe Ave is a home located in Seminole County with nearby schools including Seminole County Elementary School and Seminole County Middle/High School.
Ownership History
Date
Name
Owned For
Owner Type
Purchase Details
Closed on
Jun 30, 2010
Sold by
Bond Marsha G and Swan Gayle G
Bought by
Bryant Lawante L
Current Estimated Value
Home Financials for this Owner
Home Financials are based on the most recent Mortgage that was taken out on this home.
Original Mortgage
$107,394
Outstanding Balance
$73,645
Interest Rate
5.37%
Mortgage Type
FHA
Estimated Equity
$102,395
Purchase Details
Closed on
Jun 16, 2010
Sold by
Gibbons Betty Elaine Beasley and Gibbons Fred Chriswell
Bought by
Gibbons Betty Elaine Beasley
Home Financials for this Owner
Home Financials are based on the most recent Mortgage that was taken out on this home.
Original Mortgage
$107,394
Outstanding Balance
$73,645
Interest Rate
5.37%
Mortgage Type
FHA
Estimated Equity
$102,395
Purchase Details
Closed on
Feb 21, 1950
Sold by
Gibbons Fred
Bought by
Gibbons Fred
Create a Home Valuation Report for This Property
The Home Valuation Report is an in-depth analysis detailing your home's value as well as a comparison with similar homes in the area
Home Values in the Area
Average Home Value in this Area
Purchase History
| Date | Buyer | Sale Price | Title Company |
|---|---|---|---|
| Bryant Lawante L | $84,800 | -- | |
| Gibbons Betty Elaine Beasley | -- | -- | |
| Gibbons Fred | $1,100 | -- |
Source: Public Records
Mortgage History
| Date | Status | Borrower | Loan Amount |
|---|---|---|---|
| Open | Bryant Lawante L | $107,394 |
Source: Public Records
Tax History Compared to Growth
Tax History
| Year | Tax Paid | Tax Assessment Tax Assessment Total Assessment is a certain percentage of the fair market value that is determined by local assessors to be the total taxable value of land and additions on the property. | Land | Improvement |
|---|---|---|---|---|
| 2024 | $2,629 | $52,292 | $3,282 | $49,010 |
| 2023 | $2,631 | $52,292 | $3,282 | $49,010 |
| 2022 | $1,684 | $51,000 | $3,282 | $47,718 |
| 2021 | $1,459 | $44,114 | $3,282 | $40,832 |
| 2020 | $1,429 | $43,074 | $3,282 | $39,792 |
| 2019 | $1,369 | $41,892 | $3,282 | $38,610 |
| 2018 | $2,050 | $41,892 | $3,282 | $38,610 |
| 2017 | $1,244 | $39,137 | $3,516 | $35,621 |
| 2016 | -- | $40,296 | $3,516 | $36,779 |
| 2015 | -- | $35,412 | $3,516 | $31,895 |
| 2014 | -- | $35,412 | $3,516 | $31,895 |
| 2013 | -- | $33,798 | $3,516 | $30,282 |
Source: Public Records
Map
Nearby Homes
- 403 S Newcombe Ave
- 307 S Morris Ave
- 202 W 4th St
- 1203 S Morris Ave
- 300 W 13th St
- 508 S Tennille Ave
- 210 W Crawford St
- 816 E 6th St
- lot 565 Martin Dr
- lot 564 Martin Dr
- 308 E Carr St
- 5552 Georgia 39
- 601 Ingram St
- 5611 Sweetwater Ave
- 5660 Carter Dr
- 1068 Georgia 39
- 394 Bush Dairy Rd
- 000 Hagen Still Rd
- 000 Hagen Still Rd
- 6004 Broken Arrow Dr
- 504 S Newcombe Ave
- 602 S Newcombe Ave
- 502 S Newcombe Ave
- 507 S Newcombe Ave
- 507 S Newcombe Ave
- 606 S Newcombe Ave
- 409 W 6th St
- 500 S Newcombe Ave
- 403 W 5th St
- 505 S Newcombe Ave
- 503 Joseph Ave
- 501 Joseph Ave
- 305 W 5th St
- 602 S Morris Ave
- 508 S Morris Ave
- 408 W 7th St
- 600 Joseph Ave
- 508 Joseph Ave
- 410 S Newcombe Ave
- 504 Joseph Ave