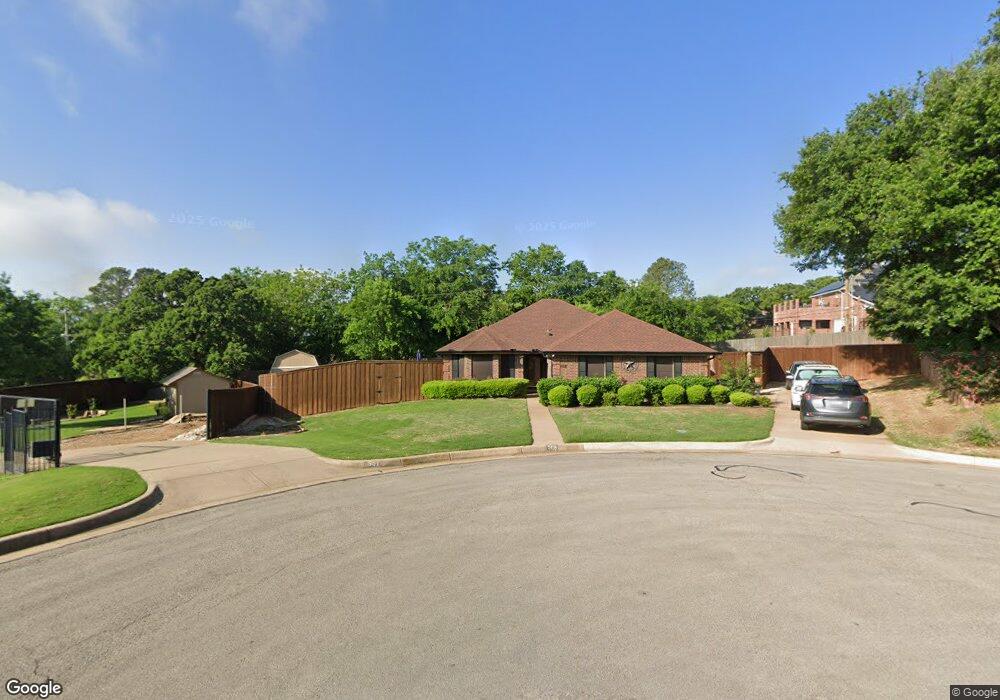
508 Shenandoah Ct Burleson, TX 76028
Estimated Value: $319,000 - $382,000
3
Beds
2
Baths
1,982
Sq Ft
$177/Sq Ft
Est. Value
About This Home
This home is located at 508 Shenandoah Ct, Burleson, TX 76028 and is currently estimated at $350,643, approximately $176 per square foot. 508 Shenandoah Ct is a home located in Johnson County with nearby schools including Mound Elementary School, Hughes Middle School, and Burleson High School.
Ownership History
Date
Name
Owned For
Owner Type
Purchase Details
Closed on
Oct 25, 2019
Sold by
Dever Martin F
Bought by
Dever Martin F
Current Estimated Value
Home Financials for this Owner
Home Financials are based on the most recent Mortgage that was taken out on this home.
Original Mortgage
$168,800
Outstanding Balance
$113,105
Interest Rate
3.7%
Mortgage Type
Stand Alone First
Estimated Equity
$237,538
Purchase Details
Closed on
May 10, 2017
Sold by
Dever Angela
Bought by
Dever Martin F
Home Financials for this Owner
Home Financials are based on the most recent Mortgage that was taken out on this home.
Original Mortgage
$152,400
Interest Rate
4.1%
Mortgage Type
Stand Alone First
Purchase Details
Closed on
Jan 17, 2013
Sold by
Deaver Angela and Deaver Martin F
Bought by
Dever Martin F and Dever Angela
Home Financials for this Owner
Home Financials are based on the most recent Mortgage that was taken out on this home.
Original Mortgage
$145,687
Interest Rate
3.34%
Mortgage Type
New Conventional
Purchase Details
Closed on
Feb 20, 2009
Sold by
Schronk Kelly J Woody
Bought by
Deaver Martin F and Deaver Angela
Home Financials for this Owner
Home Financials are based on the most recent Mortgage that was taken out on this home.
Original Mortgage
$153,370
Interest Rate
5.13%
Mortgage Type
FHA
Create a Home Valuation Report for This Property
The Home Valuation Report is an in-depth analysis detailing your home's value as well as a comparison with similar homes in the area
Home Values in the Area
Average Home Value in this Area
Purchase History
| Date | Buyer | Sale Price | Title Company |
|---|---|---|---|
| Dever Martin F | -- | None Available | |
| Dever Martin F | -- | None Available | |
| Dever Martin F | -- | -- | |
| Deaver Martin F | -- | Sendera Title |
Source: Public Records
Mortgage History
| Date | Status | Borrower | Loan Amount |
|---|---|---|---|
| Open | Dever Martin F | $168,800 | |
| Closed | Dever Martin F | $152,400 | |
| Closed | Dever Martin F | $145,687 | |
| Previous Owner | Deaver Martin F | $153,370 |
Source: Public Records
Tax History Compared to Growth
Tax History
| Year | Tax Paid | Tax Assessment Tax Assessment Total Assessment is a certain percentage of the fair market value that is determined by local assessors to be the total taxable value of land and additions on the property. | Land | Improvement |
|---|---|---|---|---|
| 2025 | $5,267 | $329,426 | $82,000 | $247,426 |
| 2024 | $6,636 | $288,870 | $0 | $0 |
| 2023 | $4,652 | $310,522 | $53,000 | $257,522 |
| 2022 | $5,554 | $310,522 | $53,000 | $257,522 |
| 2021 | $5,644 | $255,580 | $56,000 | $199,580 |
| 2020 | $5,353 | $197,302 | $56,000 | $141,302 |
| 2019 | $5,676 | $197,302 | $56,000 | $141,302 |
| 2018 | $5,676 | $197,302 | $56,000 | $141,302 |
| 2017 | $5,078 | $185,688 | $44,000 | $141,688 |
| 2016 | $4,632 | $169,387 | $44,000 | $125,387 |
| 2015 | $4,089 | $169,387 | $44,000 | $125,387 |
| 2014 | $4,089 | $165,295 | $44,000 | $121,295 |
Source: Public Records
Map
Nearby Homes
- 1006 Alta Vista Ct
- 825 Blue Ridge Dr
- 417 Sherwood Ct
- 708 Hummingbird Trail
- 566 Tanglewood Dr
- 809 Sierra Cir
- 1408 Blue Gill Ln
- 1151 Clairemont Ln
- 613 Hummingbird Trail
- 741 W Bend Blvd
- 1201 Clairemont Ln
- 1436 Steve Dr
- 1033 Mckavett Dr
- 740 W Bend Blvd
- 729 Ridgehill Dr
- 708 Creekview Dr
- 1220 Clairemont Ln
- 629 NW Sandra Ln
- 832 Pebblecreek Dr
- 132 SW Brushy Mound Rd
- 501 Shenandoah Ct
- 504 Shenandoah Ct
- 1022 Francine Ct
- 1030 Francine Ct
- 504 Kingswood Ct
- 500 Shenandoah Ct
- 921 Sierra Vista Dr
- 924 Edgehill Rd
- 508 Kingswood Ct
- 920 Edgehill Rd
- 508 Lincoln Oaks Ct
- 930 Edgehill Rd
- 431 Shenandoah Dr
- 432 Kingswood Dr
- 1198 Edgehill Rd
- 0 Edgehill Rd
- 433 Lincoln Oaks Dr
- 505 Kingswood Ct
- 1031 Francine Ct
- 500 Lincoln Oaks Ct