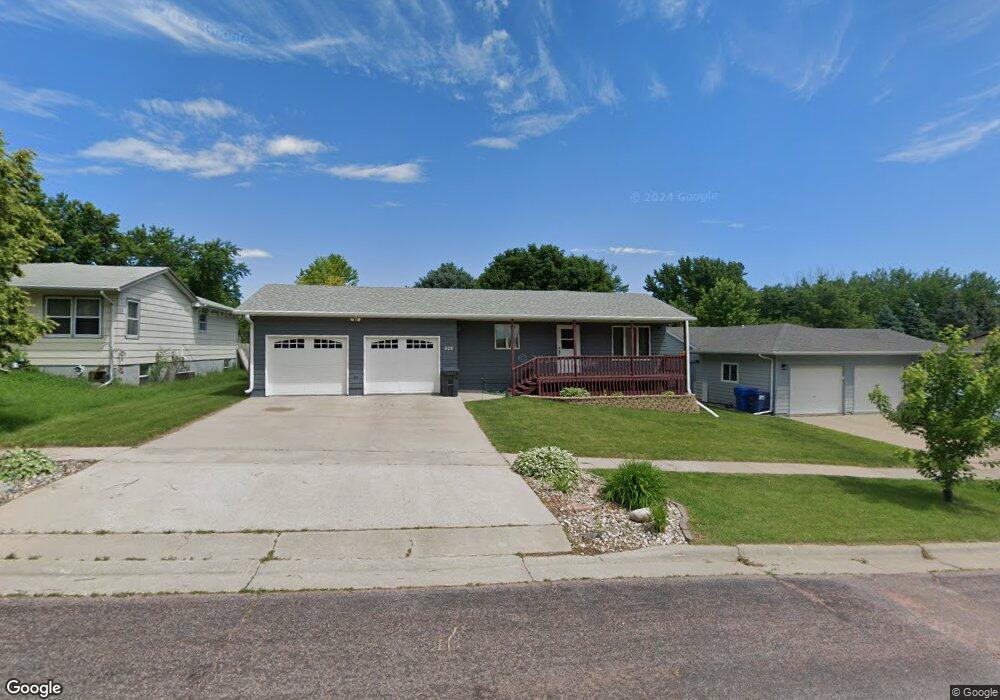
508 W 2nd St Dell Rapids, SD 57022
Estimated Value: $313,000 - $367,000
4
Beds
2
Baths
2,296
Sq Ft
$144/Sq Ft
Est. Value
About This Home
This home is located at 508 W 2nd St, Dell Rapids, SD 57022 and is currently estimated at $331,307, approximately $144 per square foot. 508 W 2nd St is a home located in Minnehaha County with nearby schools including Dell Rapids Elementary School, Dell Rapids Middle School, and Dell Rapids High School.
Ownership History
Date
Name
Owned For
Owner Type
Purchase Details
Closed on
Apr 5, 2024
Sold by
Blair Marlene Pearl and Erickson Marlene
Bought by
Welbig Nicholas and Welbig Macy
Current Estimated Value
Home Financials for this Owner
Home Financials are based on the most recent Mortgage that was taken out on this home.
Original Mortgage
$307,005
Outstanding Balance
$302,134
Interest Rate
6.88%
Estimated Equity
$29,173
Purchase Details
Closed on
Nov 22, 2023
Sold by
Erickson Lyle and Erickson Y
Bought by
Erickson Marlene and Erickson Y
Purchase Details
Closed on
Jan 25, 2021
Sold by
Walstrom Nathan A and Walstrom Beth A
Bought by
Erickson Marlene Pearl and Erickson Lyle Edward
Home Financials for this Owner
Home Financials are based on the most recent Mortgage that was taken out on this home.
Original Mortgage
$189,600
Interest Rate
2.6%
Mortgage Type
New Conventional
Create a Home Valuation Report for This Property
The Home Valuation Report is an in-depth analysis detailing your home's value as well as a comparison with similar homes in the area
Home Values in the Area
Average Home Value in this Area
Purchase History
| Date | Buyer | Sale Price | Title Company |
|---|---|---|---|
| Welbig Nicholas | $316,500 | Stewart Title Co | |
| Welbig Nicholas | $316,500 | Stewart Title Co | |
| Erickson Marlene | -- | -- | |
| Erickson Marlene Pearl | $237,000 | Stewart Title Company |
Source: Public Records
Mortgage History
| Date | Status | Borrower | Loan Amount |
|---|---|---|---|
| Open | Welbig Nicholas | $307,005 | |
| Closed | Welbig Nicholas | $307,005 | |
| Previous Owner | Erickson Marlene Pearl | $189,600 |
Source: Public Records
Tax History
| Year | Tax Paid | Tax Assessment Tax Assessment Total Assessment is a certain percentage of the fair market value that is determined by local assessors to be the total taxable value of land and additions on the property. | Land | Improvement |
|---|---|---|---|---|
| 2024 | $3,585 | $265,200 | $20,400 | $244,800 |
| 2023 | $3,020 | $211,800 | $20,400 | $191,400 |
| 2022 | $3,195 | $211,800 | $20,400 | $191,400 |
| 2021 | $2,714 | $174,400 | $0 | $0 |
| 2020 | $2,714 | $168,800 | $0 | $0 |
| 2019 | $2,693 | $171,835 | $0 | $0 |
| 2018 | $2,625 | $162,315 | $0 | $0 |
| 2017 | $2,416 | $158,443 | $17,768 | $140,675 |
| 2016 | $2,416 | $143,365 | $17,768 | $125,597 |
| 2015 | $2,442 | $138,710 | $17,767 | $120,943 |
| 2014 | -- | $129,316 | $17,767 | $111,549 |
Source: Public Records
Map
Nearby Homes
- 809 W 3rd St
- 300 W 8th St
- 0 Lt 1 Bk 8 Birdie Dr
- 0 Lt 3 Bk 8 Birdie Dr Dr
- 0 Lt 2 Bk 8 Birdie Dr
- 207 E 9th St
- 0 Lt 4 Bk 8 Birdie Dr Dr
- 0 Cir
- Bk10 Lot26 Tee Off Trail
- Bk17Lt3A3B Tee Off Trail
- Bk18 Lot3 Tee Off Trail
- Blk19 Lot1 Tee Off Trail
- Bk17Lt6A6B Tee Off Trail
- B17L1A1B1C Tee Off Trail
- Blk19 Lot2 Tee Off Trail
- Bk17L2A,2B Tee Off Trail
- Bk18 Lot2 Tee Off Trail
- Bk17Lt5A5B Tee Off Trail
- Bk17Lt4A4B Tee Off Trail
- Bk18 Lot 1 Tee Off Trail
Your Personal Tour Guide
Ask me questions while you tour the home.