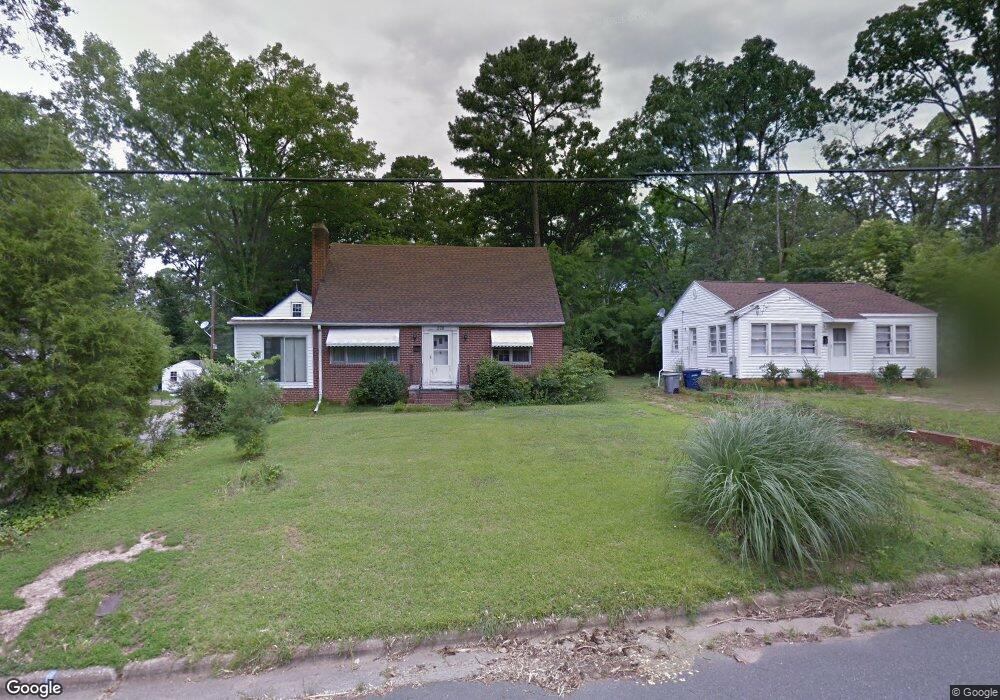
508 W Chisholm St Unit Blue Sanford, NC 27330
Estimated Value: $328,000 - $392,000
1
Bed
2
Baths
1,000
Sq Ft
$348/Sq Ft
Est. Value
About This Home
This home is located at 508 W Chisholm St Unit Blue, Sanford, NC 27330 and is currently estimated at $347,722, approximately $347 per square foot. 508 W Chisholm St Unit Blue is a home located in Lee County with nearby schools including Benjamin T. Bullock Elementary School, West Lee Middle School, and Lee County High School.
Ownership History
Date
Name
Owned For
Owner Type
Purchase Details
Closed on
Mar 10, 2022
Sold by
Jonah Haller Andrew
Bought by
Powell Ashley
Current Estimated Value
Home Financials for this Owner
Home Financials are based on the most recent Mortgage that was taken out on this home.
Original Mortgage
$283,864
Outstanding Balance
$265,010
Interest Rate
3.85%
Mortgage Type
VA
Estimated Equity
$82,712
Purchase Details
Closed on
Nov 25, 2020
Sold by
Miller Todd Ashley and Lee Binna
Bought by
Haller Andrew Jonah
Home Financials for this Owner
Home Financials are based on the most recent Mortgage that was taken out on this home.
Original Mortgage
$192,000
Interest Rate
2.8%
Mortgage Type
New Conventional
Purchase Details
Closed on
Dec 5, 2018
Sold by
Gribbins Angela H and Gribbins Christopher S
Bought by
Miller Todd Ashley
Purchase Details
Closed on
Oct 15, 2013
Sold by
Matthews Robert W
Bought by
Hall Nancy M
Create a Home Valuation Report for This Property
The Home Valuation Report is an in-depth analysis detailing your home's value as well as a comparison with similar homes in the area
Home Values in the Area
Average Home Value in this Area
Purchase History
| Date | Buyer | Sale Price | Title Company |
|---|---|---|---|
| Powell Ashley | $274,000 | None Listed On Document | |
| Haller Andrew Jonah | $240,000 | None Available | |
| Miller Todd Ashley | $92,500 | None Available | |
| Hall Nancy M | -- | None Available |
Source: Public Records
Mortgage History
| Date | Status | Borrower | Loan Amount |
|---|---|---|---|
| Open | Powell Ashley | $283,864 | |
| Previous Owner | Haller Andrew Jonah | $192,000 |
Source: Public Records
Tax History Compared to Growth
Tax History
| Year | Tax Paid | Tax Assessment Tax Assessment Total Assessment is a certain percentage of the fair market value that is determined by local assessors to be the total taxable value of land and additions on the property. | Land | Improvement |
|---|---|---|---|---|
| 2025 | $4,212 | $293,000 | $20,300 | $272,700 |
| 2024 | $4,172 | $293,000 | $20,300 | $272,700 |
| 2023 | $4,152 | $293,000 | $20,300 | $272,700 |
| 2022 | $3,425 | $206,300 | $10,200 | $196,100 |
| 2021 | $3,467 | $206,300 | $10,200 | $196,100 |
| 2020 | $2,771 | $156,400 | $10,200 | $146,200 |
| 2019 | $2,321 | $129,500 | $10,200 | $119,300 |
| 2018 | $2,227 | $125,600 | $15,000 | $110,600 |
| 2017 | $2,202 | $125,600 | $15,000 | $110,600 |
| 2016 | $2,152 | $125,600 | $15,000 | $110,600 |
| 2014 | $2,058 | $125,600 | $15,000 | $110,600 |
Source: Public Records
Map
Nearby Homes
- 506 Cross St
- 505 Cross St
- 0 N Gulf St Unit 10076514
- 0 N Gulf St Unit 10079395
- 500 N Gulf St
- 504 Summitt Dr
- 702 N Vance St
- 612 W Chisholm St
- 321 N Steele St
- 620 Carr St
- 1234 Beta (Lot 19) Ct
- 106 Chella Ct
- 102 Chella Ct
- 113 Rosemont Ln
- 703 Bennett St
- 210 N Monroe Ave
- 815 Park Ave
- 909 Whitford St
- 822 Fitts St
- 508 W Chisholm St
- 508 W Chisholm St Unit Green
- 508 W Chisholm St
- 508A W Chisholm St Unit Whole
- 508A W Chisholm St Unit Lower
- 508A W Chisholm St Unit Upper
- 508A W Chisholm St Unit A2
- 508A W Chisholm St Unit A1
- 510 W Chisholm St
- 506 W Chisholm St
- 512 W Chisholm St
- 509 Bracken St
- 507 Bracken St
- 513 Bracken St
- 401 N Vance St
- 405 A-C Vance St
- 405 N Vance St
- 511 W Chisholm St
- 507 W Chisholm St
- 513 W Chisholm St