Estimated Value: $101,000 - $150,000
4
Beds
2
Baths
2,178
Sq Ft
$61/Sq Ft
Est. Value
About This Home
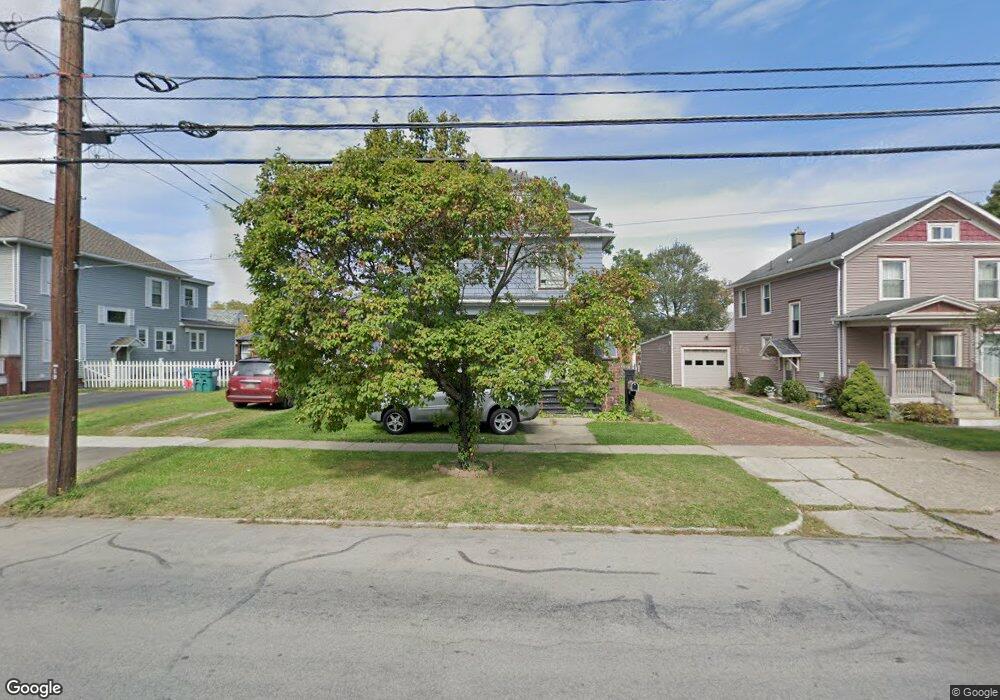
This home is located at 508 W Henley St, Olean, NY 14760 and is currently estimated at $131,848, approximately $60 per square foot. 508 W Henley St is a home located in Cattaraugus County with nearby schools including Olean Intermediate-Middle School, Olean Senior High School, and Southern Tier Catholic School.
Ownership History
Date
Name
Owned For
Owner Type
Purchase Details
Closed on
Aug 15, 2014
Sold by
Mousaw Ivan H
Bought by
Peters Alan J
Current Estimated Value
Home Financials for this Owner
Home Financials are based on the most recent Mortgage that was taken out on this home.
Original Mortgage
$77,075
Outstanding Balance
$59,335
Interest Rate
4.37%
Mortgage Type
FHA
Estimated Equity
$72,513
Purchase Details
Closed on
Jan 19, 2001
Sold by
Benett Susan
Bought by
Mousaw Ivan H
Purchase Details
Closed on
Jan 4, 2001
Sold by
Benett Susan
Bought by
Mousaw Ivan H
Create a Home Valuation Report for This Property
The Home Valuation Report is an in-depth analysis detailing your home's value as well as a comparison with similar homes in the area
Home Values in the Area
Average Home Value in this Area
Purchase History
| Date | Buyer | Sale Price | Title Company |
|---|---|---|---|
| Peters Alan J | $78,500 | Daniel R. Palumbo | |
| Mousaw Ivan H | $70,000 | Gregory E Shemeld | |
| Mousaw Ivan H | $70,000 | Gregory E Shemeld |
Source: Public Records
Mortgage History
| Date | Status | Borrower | Loan Amount |
|---|---|---|---|
| Open | Peters Alan J | $77,075 |
Source: Public Records
Tax History
| Year | Tax Paid | Tax Assessment Tax Assessment Total Assessment is a certain percentage of the fair market value that is determined by local assessors to be the total taxable value of land and additions on the property. | Land | Improvement |
|---|---|---|---|---|
| 2024 | $4,489 | $71,000 | $3,600 | $67,400 |
| 2023 | $2,673 | $71,000 | $3,600 | $67,400 |
| 2022 | $2,712 | $71,000 | $3,600 | $67,400 |
| 2021 | $2,790 | $71,000 | $3,600 | $67,400 |
| 2020 | $2,809 | $71,000 | $3,600 | $67,400 |
| 2019 | $1,765 | $71,000 | $3,600 | $67,400 |
| 2018 | $4,309 | $71,000 | $3,600 | $67,400 |
| 2017 | $2,878 | $71,000 | $3,600 | $67,400 |
| 2016 | $2,847 | $71,000 | $3,600 | $67,400 |
| 2015 | -- | $71,000 | $3,600 | $67,400 |
| 2014 | -- | $71,000 | $3,600 | $67,400 |
Source: Public Records
Map
Nearby Homes
Your Personal Tour Guide
Ask me questions while you tour the home.