Estimated Value: $92,084 - $116,000
--
Bed
--
Bath
830
Sq Ft
$128/Sq Ft
Est. Value
About This Home
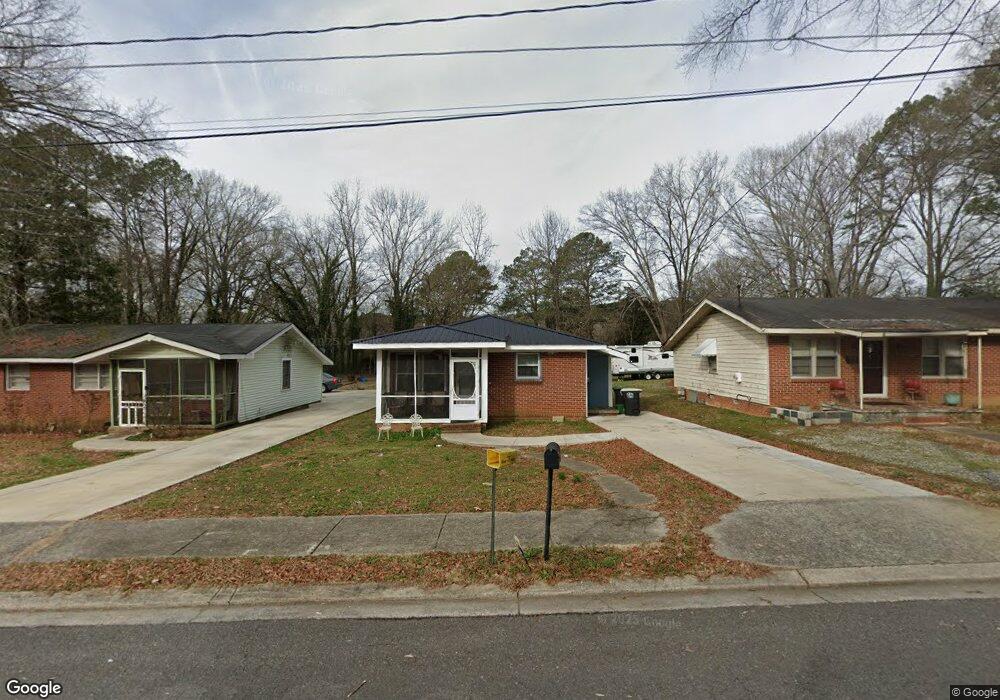
This home is located at 508 Wilson Ave SW, Rome, GA 30161 and is currently estimated at $106,271, approximately $128 per square foot. 508 Wilson Ave SW is a home located in Floyd County with nearby schools including Dan McCarty Middle School, Rome High School, and Darlington School.
Ownership History
Date
Name
Owned For
Owner Type
Purchase Details
Closed on
Nov 30, 2018
Sold by
Brown Earl
Bought by
Brown Brown Earl Earl and Brown Boyd Valerie
Current Estimated Value
Purchase Details
Closed on
Dec 16, 1975
Sold by
Adm Of V A
Bought by
Brown Earl and Jo Ann
Purchase Details
Closed on
Mar 17, 1975
Sold by
Franklin Savings Bank Of N Y
Bought by
Adm Of V A
Purchase Details
Closed on
Jan 1, 1975
Sold by
Marybury Leon
Bought by
Franklin Savings Bank Of N Y
Purchase Details
Closed on
Jan 1, 1973
Sold by
Drummond Danny
Bought by
Marybury Leon
Purchase Details
Closed on
Jan 2, 1972
Sold by
N A Acceptance Corp
Bought by
Drummond Danny
Purchase Details
Closed on
Jan 1, 1972
Sold by
Hill William and Lillie Mae
Bought by
N A Acceptance Corp
Purchase Details
Closed on
Jan 1, 1965
Sold by
Howell Adrian
Bought by
Hill William and Lillie Mae
Purchase Details
Closed on
Jan 1, 1962
Bought by
Howell Adrian
Create a Home Valuation Report for This Property
The Home Valuation Report is an in-depth analysis detailing your home's value as well as a comparison with similar homes in the area
Home Values in the Area
Average Home Value in this Area
Purchase History
| Date | Buyer | Sale Price | Title Company |
|---|---|---|---|
| Brown Brown Earl Earl | -- | -- | |
| Brown Brown Earl Earl | -- | -- | |
| Brown Earl | -- | -- | |
| Adm Of V A | -- | -- | |
| Franklin Savings Bank Of N Y | $13,300 | -- | |
| Marybury Leon | $13,000 | -- | |
| Drummond Danny | -- | -- | |
| N A Acceptance Corp | $7,500 | -- | |
| Hill William | $9,000 | -- | |
| Howell Adrian | -- | -- |
Source: Public Records
Tax History Compared to Growth
Tax History
| Year | Tax Paid | Tax Assessment Tax Assessment Total Assessment is a certain percentage of the fair market value that is determined by local assessors to be the total taxable value of land and additions on the property. | Land | Improvement |
|---|---|---|---|---|
| 2024 | $276 | $30,351 | $4,752 | $25,599 |
| 2023 | $277 | $28,824 | $4,320 | $24,504 |
| 2022 | $285 | $19,899 | $3,456 | $16,443 |
| 2021 | $286 | $18,077 | $3,456 | $14,621 |
| 2020 | $282 | $16,451 | $2,700 | $13,751 |
| 2019 | $261 | $15,603 | $2,700 | $12,903 |
| 2018 | $244 | $14,754 | $2,700 | $12,054 |
| 2017 | $234 | $14,224 | $2,700 | $11,524 |
| 2016 | $229 | $13,912 | $2,680 | $11,232 |
| 2015 | -- | $13,912 | $2,680 | $11,232 |
| 2014 | -- | $13,912 | $2,680 | $11,232 |
Source: Public Records
Map
Nearby Homes
- 410 Hardy Ave SW
- 3 Porter St SW
- 3 Grover St SW
- 529 Branham Ave SW
- 218 Wilson Ave SW
- 107 Butler St SW
- 334 Branham Ave SW
- 515 Harper Ave SW
- 110 Cherokee St SW
- 18 Butler St SW
- 101 Hardy Ave SW
- 111 Lookout Cir SW
- 113 Lookout Cir SW
- 11 Blacks Bluff Rd SW
- 115 Lookout Cir SW
- 515 S Broad St SW
- 105 Mary St SW
- 204 Myrtle St SW
- 232 S Broad St SW
- 506 Wilson Ave SW
- 506 Wilson Ave SW
- 510 Wilson Ave SW
- 504 Wilson Ave SW
- 512 Wilson Ave SW
- 302 Porter St SW
- 304 Porter St SW
- 505 Cotton Ave SW
- 300 Porter St SW
- 503 Cotton Ave SW
- 306 Porter St SW
- 513 Wilson Ave SW
- 511 Wilson Ave SW
- 509 Wilson Ave SW
- 509 Cotton Ave SW
- 308 Porter St SW
- 501 Cotton Ave SW
- 500 Wilson Ave SW
- 405 Grover St SW
- 507 Wilson Ave SW