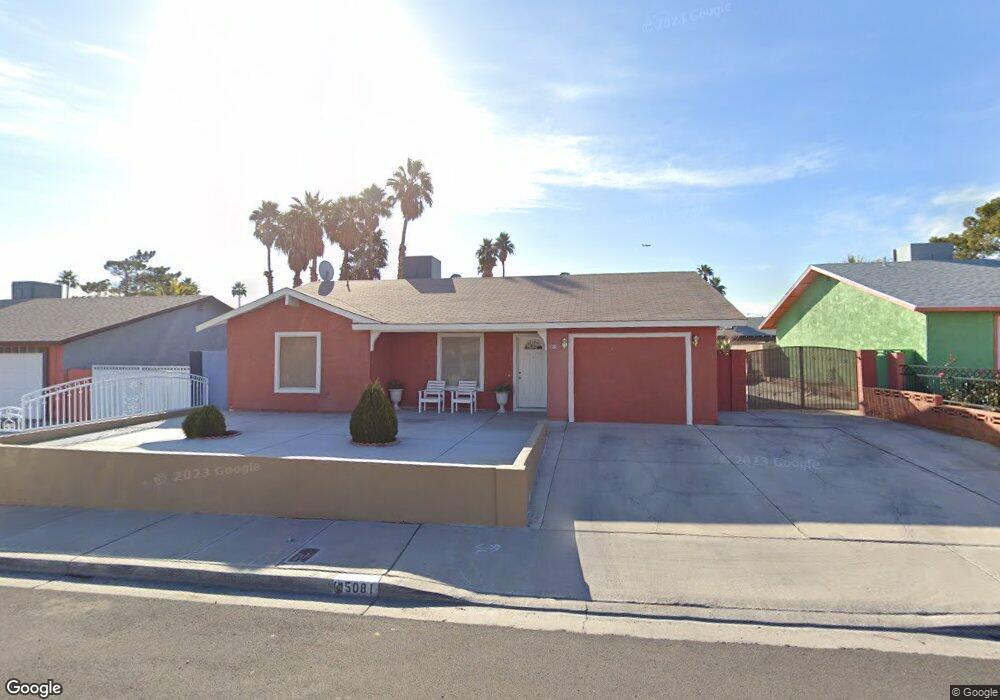
5081 Danica Way Unit 1 Las Vegas, NV 89122
Estimated Value: $298,000 - $358,000
3
Beds
2
Baths
1,168
Sq Ft
$283/Sq Ft
Est. Value
About This Home
This home is located at 5081 Danica Way Unit 1, Las Vegas, NV 89122 and is currently estimated at $330,770, approximately $283 per square foot. 5081 Danica Way Unit 1 is a home located in Clark County with nearby schools including Harley Harmon Elementary School, Francis H Cortney Junior High School, and Del Sol Academy of the Performing Arts.
Ownership History
Date
Name
Owned For
Owner Type
Purchase Details
Closed on
May 11, 2011
Sold by
Secretary Of Housing & Urban Development
Bought by
Macias Guzman Carolina
Current Estimated Value
Purchase Details
Closed on
Apr 21, 2010
Sold by
U S Bank N A
Bought by
Secretary Of Housing & Urban Development
Purchase Details
Closed on
May 14, 2007
Sold by
Ortega Juan and Ortega Martha M
Bought by
Morones Jose Luis and Morones Graciela Macias
Home Financials for this Owner
Home Financials are based on the most recent Mortgage that was taken out on this home.
Original Mortgage
$231,369
Interest Rate
6.17%
Mortgage Type
FHA
Purchase Details
Closed on
Jun 18, 1999
Sold by
Stetson Maria N
Bought by
Ortega Juan and Ortega Martha M
Home Financials for this Owner
Home Financials are based on the most recent Mortgage that was taken out on this home.
Original Mortgage
$92,454
Interest Rate
7.05%
Mortgage Type
FHA
Create a Home Valuation Report for This Property
The Home Valuation Report is an in-depth analysis detailing your home's value as well as a comparison with similar homes in the area
Home Values in the Area
Average Home Value in this Area
Purchase History
| Date | Buyer | Sale Price | Title Company |
|---|---|---|---|
| Macias Guzman Carolina | $57,500 | Nevada Title Las Vegas | |
| Secretary Of Housing & Urban Development | $255,993 | None Available | |
| Us Bank Na | $255,993 | None Available | |
| Morones Jose Luis | $235,000 | Chicago Title | |
| Ortega Juan | $93,000 | First American Title Co |
Source: Public Records
Mortgage History
| Date | Status | Borrower | Loan Amount |
|---|---|---|---|
| Previous Owner | Morones Jose Luis | $231,369 | |
| Previous Owner | Ortega Juan | $92,454 |
Source: Public Records
Tax History Compared to Growth
Tax History
| Year | Tax Paid | Tax Assessment Tax Assessment Total Assessment is a certain percentage of the fair market value that is determined by local assessors to be the total taxable value of land and additions on the property. | Land | Improvement |
|---|---|---|---|---|
| 2025 | $715 | $48,967 | $26,250 | $22,717 |
| 2024 | $695 | $48,967 | $26,250 | $22,717 |
| 2023 | $566 | $47,418 | $24,850 | $22,568 |
| 2022 | $675 | $43,423 | $22,400 | $21,023 |
| 2021 | $655 | $41,402 | $21,000 | $20,402 |
| 2020 | $633 | $39,865 | $19,250 | $20,615 |
| 2019 | $615 | $35,709 | $15,050 | $20,659 |
| 2018 | $597 | $34,184 | $14,000 | $20,184 |
| 2017 | $998 | $34,026 | $13,300 | $20,726 |
| 2016 | $566 | $28,833 | $7,350 | $21,483 |
| 2015 | $564 | $26,291 | $7,350 | $18,941 |
| 2014 | $548 | $18,424 | $5,250 | $13,174 |
Source: Public Records
Map
Nearby Homes
- 5030 E Hacienda Ave
- 4999 Nellis Cir
- 5437 Morris St
- 4924 Elaina Ave
- 5240 Fire Night Ave
- 5289 Chattanooga Ave
- 5054 Brownwood Ave
- 5284 Wellesley Ave
- 5359 Chattanooga Ave
- 5068 Killarney St
- 5022 Carmel Ave Unit 3
- 5073 Gains Mill St
- 5250 Vicksburg Ave
- 5240 Denning St
- 4948 Orinda Cir Unit 5
- 4915 E Russell Rd
- 5457 Tunis Ave
- 5540 Hobble Creek Dr
- 5271 Ithaca Ave
- 4990 Denning St
- 5091 Danica Way
- 5071 Danica Way
- 5082 Tahnee Dr
- 5092 Tahnee Dr
- 5072 Tahnee Dr Unit 1
- 5101 Danica Way
- 5061 Danica Way
- 5082 Danica Way Unit 1
- 5102 Tahnee Dr
- 5062 Tahnee Dr
- 5072 Danica Way
- 5092 Danica Way
- 5051 Danica Way
- 5111 Danica Way
- 5062 Danica Way Unit 1
- 5102 Danica Way
- 5052 Tahnee Dr
- 5112 Tahnee Dr
- 5112 Danica Way
- 5398 Bernadette St