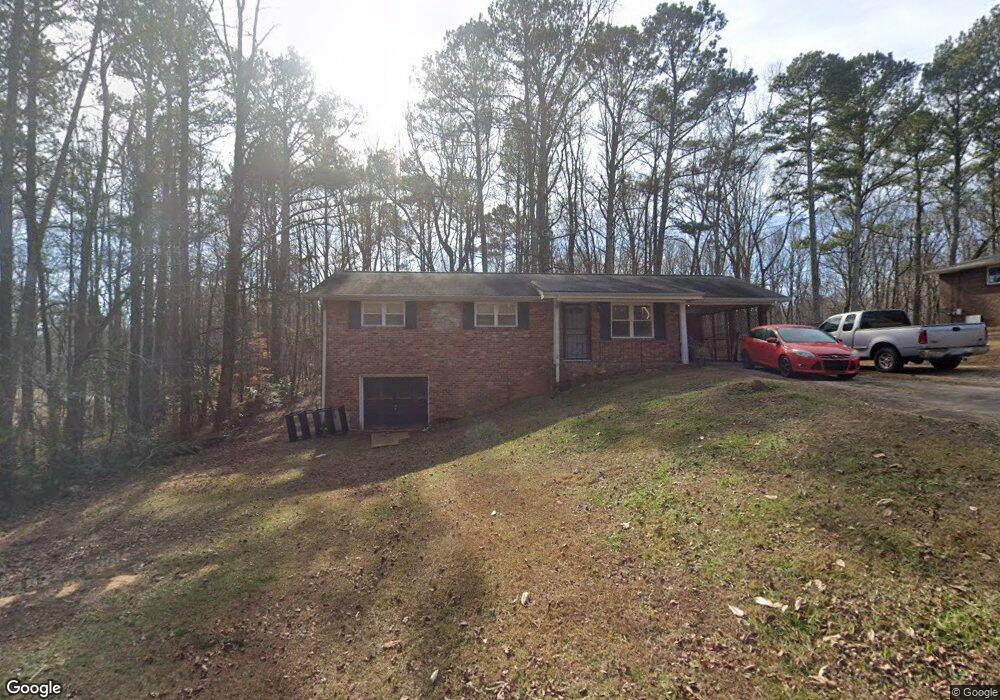
5081 Springbrook Dr Unit 3 Douglasville, GA 30135
Estimated Value: $196,000 - $214,000
3
Beds
2
Baths
1,121
Sq Ft
$182/Sq Ft
Est. Value
About This Home
This home is located at 5081 Springbrook Dr Unit 3, Douglasville, GA 30135 and is currently estimated at $203,746, approximately $181 per square foot. 5081 Springbrook Dr Unit 3 is a home located in Douglas County with nearby schools including Chapel Hill Elementary School, Chapel Hill Middle School, and Chapel Hill High School.
Ownership History
Date
Name
Owned For
Owner Type
Purchase Details
Closed on
May 9, 2015
Sold by
Wilbanks Helen
Bought by
Barfield Robert B
Current Estimated Value
Purchase Details
Closed on
Sep 30, 2011
Sold by
Federal National Mortgage Association
Bought by
Wilbanks Helen
Purchase Details
Closed on
Aug 10, 2011
Sold by
Bank Of America Na
Bought by
Federal National Mtg Associati
Purchase Details
Closed on
Oct 5, 1998
Sold by
Witt Peggy
Bought by
Allen Danny L and Allen Corinne M
Home Financials for this Owner
Home Financials are based on the most recent Mortgage that was taken out on this home.
Original Mortgage
$65,250
Interest Rate
6.47%
Mortgage Type
New Conventional
Purchase Details
Closed on
Jul 1, 1994
Sold by
Krider James and Brown Edward I
Bought by
Witt Peggy
Create a Home Valuation Report for This Property
The Home Valuation Report is an in-depth analysis detailing your home's value as well as a comparison with similar homes in the area
Home Values in the Area
Average Home Value in this Area
Purchase History
| Date | Buyer | Sale Price | Title Company |
|---|---|---|---|
| Barfield Robert B | -- | -- | |
| Barfield Robert B | -- | -- | |
| Wilbanks Helen | $33,000 | -- | |
| Federal National Mtg Associati | $8,477 | -- | |
| Allen Danny L | $72,500 | -- | |
| Witt Peggy | $25,000 | -- |
Source: Public Records
Mortgage History
| Date | Status | Borrower | Loan Amount |
|---|---|---|---|
| Previous Owner | Allen Danny L | $65,250 | |
| Closed | Witt Peggy | -- |
Source: Public Records
Tax History Compared to Growth
Tax History
| Year | Tax Paid | Tax Assessment Tax Assessment Total Assessment is a certain percentage of the fair market value that is determined by local assessors to be the total taxable value of land and additions on the property. | Land | Improvement |
|---|---|---|---|---|
| 2024 | $668 | $61,400 | $16,240 | $45,160 |
| 2023 | $668 | $82,240 | $17,920 | $64,320 |
| 2022 | $1,999 | $61,400 | $16,240 | $45,160 |
| 2021 | $1,522 | $46,680 | $14,840 | $31,840 |
| 2020 | $1,380 | $41,600 | $12,720 | $28,880 |
| 2019 | $1,266 | $40,880 | $12,720 | $28,160 |
| 2018 | $1,095 | $35,200 | $11,280 | $23,920 |
| 2017 | $853 | $26,880 | $9,360 | $17,520 |
| 2016 | $876 | $27,156 | $9,720 | $17,436 |
| 2015 | $894 | $27,120 | $9,960 | $17,160 |
| 2014 | $725 | $21,588 | $8,280 | $13,308 |
| 2013 | -- | $24,800 | $9,600 | $15,200 |
Source: Public Records
Map
Nearby Homes
- 4975 Springbrook Dr
- 4135 Coursey Lake Rd
- 4954 Springbrook Dr
- 4906 Springbrook Dr
- 4896 Central Church Rd
- 4079 Parks Ln
- 4345 Firefox
- 3845 Reynolds Rd
- 4901 Planters Walk
- 4758 Old Briar Trail Unit 2
- 0 Coursey Lake Rd Unit 10616515
- 5225 Turtle Creek Dr
- 4616 Town Manor Dr
- 3992 Joshua Ln
- 5401 S Lake Dr
- 4765 Smokestone Dr
- 4566 Town Manor Dr
- 5492 Twin Oak Dr
- 5471 S Lake Dr
- 0 Mill Lake Rd Unit 7533947
- 5093 Springbrook Dr
- 5093 Springbrook Dr
- 5046 Springbrook Dr Unit 3
- 5105 Springbrook Dr
- 5058 Springbrook Dr
- 4202 Coursey Lake Rd
- 5070 Springbrook Dr
- 5117 Springbrook Dr
- 5047 Lisa Ct
- 5035 Lisa Ct
- 5059 Lisa Ct
- 4101 Reynolds Rd
- 5023 Lisa Ct
- 4100 Coursey Lake Rd
- 4050 Dixie Ln Unit 3
- 5071 Lisa Ct
- 4090 Coursey Lake Rd
- 4987 Springbrook Dr Unit 3
- 5083 Lisa Ct
- 4059 Springbrook Dr