Estimated Value: $364,000 - $417,000
3
Beds
2
Baths
1,873
Sq Ft
$202/Sq Ft
Est. Value
About This Home
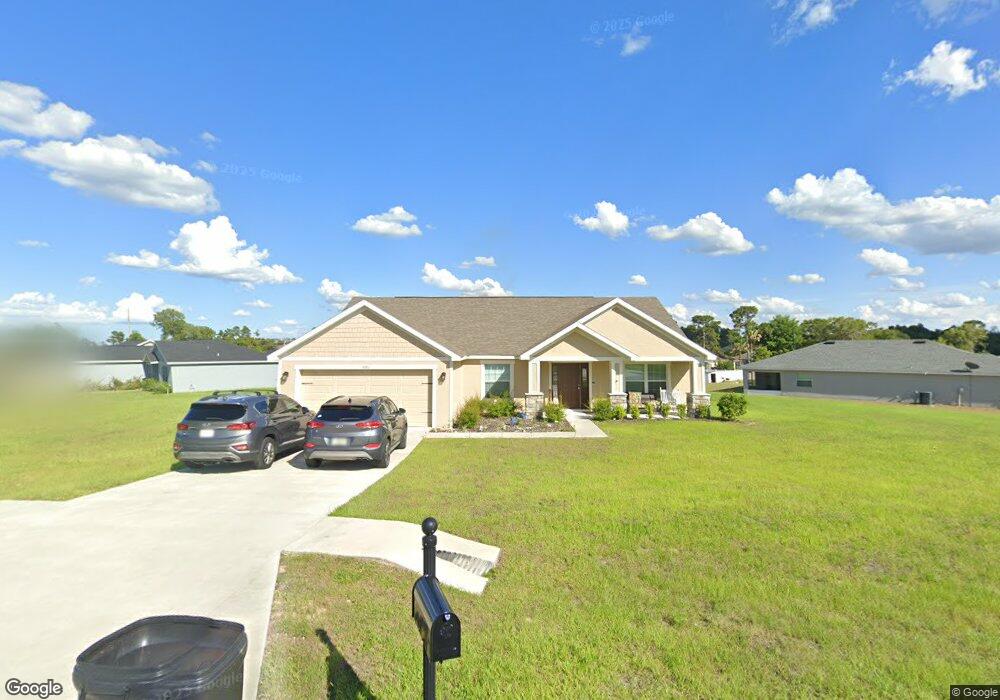
This home is located at 5081 SW 104th Loop, Ocala, FL 34476 and is currently estimated at $379,187, approximately $202 per square foot. 5081 SW 104th Loop is a home with nearby schools including Hammett Bowen Jr. Elementary School, Liberty Middle School, and West Port High School.
Ownership History
Date
Name
Owned For
Owner Type
Purchase Details
Closed on
Mar 27, 2020
Sold by
Clayton Properties Group Inc
Bought by
Colclough Tyler J and Colclough Sierra
Current Estimated Value
Home Financials for this Owner
Home Financials are based on the most recent Mortgage that was taken out on this home.
Original Mortgage
$220,013
Outstanding Balance
$193,204
Interest Rate
3.4%
Mortgage Type
New Conventional
Estimated Equity
$185,983
Purchase Details
Closed on
May 31, 2019
Sold by
Adams Adams Lou Anne Lou Anne
Bought by
Layton Propertires Group Inc
Purchase Details
Closed on
Oct 12, 2015
Sold by
Adams Robert D and Adams Lou Anne
Bought by
Robert D Adams & Lou Anne Adams Joint Re
Create a Home Valuation Report for This Property
The Home Valuation Report is an in-depth analysis detailing your home's value as well as a comparison with similar homes in the area
Home Values in the Area
Average Home Value in this Area
Purchase History
| Date | Buyer | Sale Price | Title Company |
|---|---|---|---|
| Colclough Tyler J | $253,000 | Innovation Title Llc | |
| Layton Propertires Group Inc | $339,700 | Innovative Title Llc | |
| Robert D Adams & Lou Anne Adams Joint Re | -- | Attorney |
Source: Public Records
Mortgage History
| Date | Status | Borrower | Loan Amount |
|---|---|---|---|
| Open | Colclough Tyler J | $220,013 |
Source: Public Records
Tax History
| Year | Tax Paid | Tax Assessment Tax Assessment Total Assessment is a certain percentage of the fair market value that is determined by local assessors to be the total taxable value of land and additions on the property. | Land | Improvement |
|---|---|---|---|---|
| 2025 | $3,231 | $217,088 | -- | -- |
| 2024 | $2,977 | $210,970 | -- | -- |
| 2023 | $2,903 | $204,825 | $0 | $0 |
| 2022 | $2,822 | $198,859 | $0 | $0 |
| 2021 | $2,819 | $193,067 | $0 | $0 |
| 2020 | $328 | $18,988 | $18,988 | $0 |
| 2019 | $363 | $21,430 | $21,430 | $0 |
| 2018 | $314 | $18,717 | $18,717 | $0 |
| 2017 | $287 | $16,954 | $16,954 | $0 |
| 2016 | $291 | $16,954 | $0 | $0 |
| 2015 | $307 | $17,632 | $0 | $0 |
| 2014 | $281 | $16,954 | $0 | $0 |
Source: Public Records
Map
Nearby Homes
- 5041 SW 104th Loop
- TBD SW 104th Street Rd
- 10411 SW 52nd Ct
- 10512 SW 49th Ave
- 10381 SW 48th Ave
- TBD SW 104th St
- 4890 SW 100th St
- 15482 SW 55 Av Rd
- 9977 SW 51st Ct
- 9961 SW 55th Avenue Rd
- 4830 SW 100th St
- 4938 SW 99th Place
- 9903 SW 55th Avenue Rd
- 10645 SW 51st Ave
- 4671 SW 100th Ln
- 4642 SW 100th Ln
- 10500 SW 54th Ct
- 10710 SW 49th Ave
- 4909 SW 107th Loop
- 10716 SW 53rd Cir
- 0 SW 102 Ln Rd Unit OM396491
- 0 SW 102 Ln Rd Unit OM326959
- 0 SW 102 Ln Rd Unit OM308009
- 0 SW 102 Ln Rd Unit OM302290
- 4555 SW 102nd Lane Rd Unit 102
- 4773 SW 102nd Lane Rd
- 0 SW 102 Ln Rd
- 5076 SW 104th Loop
- 5073 SW 104th Loop
- 5080 SW 104th Loop
- 10320 SW 50th Ct
- 5084 SW 104th Loop
- 5072 SW 104th Loop
- 5088 SW 104th Loop
- 5097 SW 104th Loop
- 5069 SW 104th Loop
- 5092 SW 104th Loop
- 5068 SW 104th Loop
- 10340 SW 50th Ct
- 5096 SW 104th Loop
Your Personal Tour Guide
Ask me questions while you tour the home.