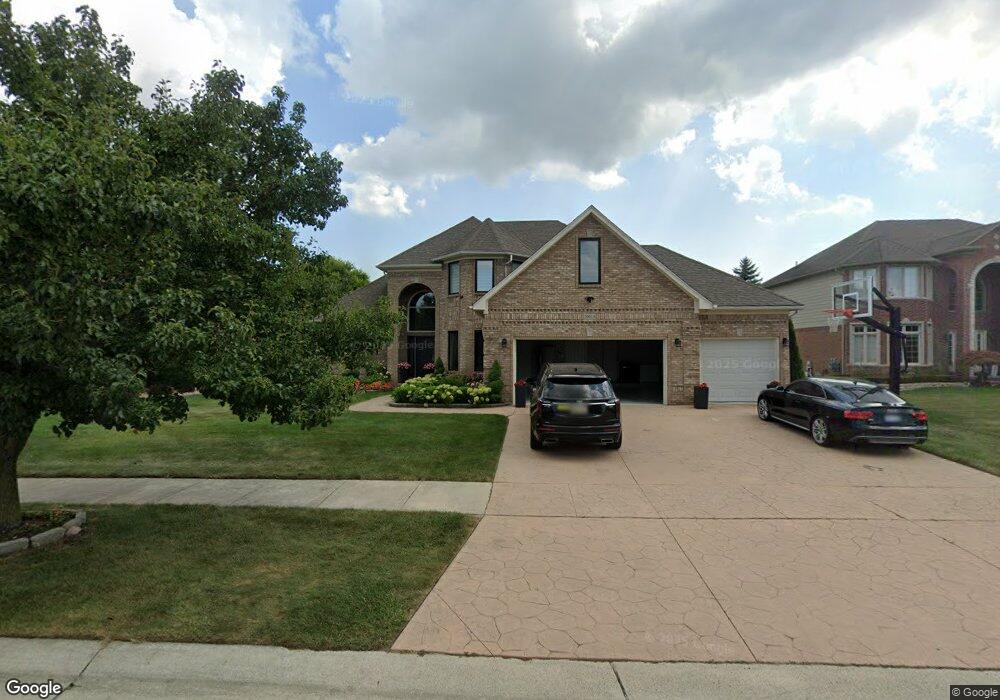
50814 Nesting Ridge Dr Macomb, MI 48044
Estimated Value: $518,502 - $609,000
4
Beds
3
Baths
3,000
Sq Ft
$192/Sq Ft
Est. Value
About This Home
This home is located at 50814 Nesting Ridge Dr, Macomb, MI 48044 and is currently estimated at $575,126, approximately $191 per square foot. 50814 Nesting Ridge Dr is a home located in Macomb County with nearby schools including Shawnee Elementary School, Seneca Middle School, and Dakota High School.
Ownership History
Date
Name
Owned For
Owner Type
Purchase Details
Closed on
Jan 16, 2023
Sold by
Lulaj Kujtim
Bought by
Lulaj Kujtim and Shelinaj Kristine
Current Estimated Value
Purchase Details
Closed on
Mar 29, 2017
Sold by
Lulaj Rrock and Lulaj Vitore
Bought by
Lulaj Kujtim and Lulaj Rrock
Home Financials for this Owner
Home Financials are based on the most recent Mortgage that was taken out on this home.
Original Mortgage
$249,500
Interest Rate
4.15%
Mortgage Type
New Conventional
Purchase Details
Closed on
Mar 2, 2017
Sold by
Wilmington Savings Fund Society Fsb
Bought by
Lulaj Rrok
Home Financials for this Owner
Home Financials are based on the most recent Mortgage that was taken out on this home.
Original Mortgage
$249,500
Interest Rate
4.15%
Mortgage Type
New Conventional
Purchase Details
Closed on
Apr 8, 2016
Sold by
Talia Athir F and Talia Jina
Bought by
Wilmington Savings Fund Society Fsb and Christiana Trust
Purchase Details
Closed on
Jan 14, 2005
Sold by
Signature Construction Co
Bought by
Talia Athir F
Purchase Details
Closed on
Mar 3, 2004
Sold by
Michaelangelo Construction Co
Bought by
Signature Construction Inc
Create a Home Valuation Report for This Property
The Home Valuation Report is an in-depth analysis detailing your home's value as well as a comparison with similar homes in the area
Home Values in the Area
Average Home Value in this Area
Purchase History
| Date | Buyer | Sale Price | Title Company |
|---|---|---|---|
| Lulaj Kujtim | -- | -- | |
| Lulaj Kujtim | -- | None Available | |
| Lulaj Rrok | $312,000 | Servicelink Llc | |
| Wilmington Savings Fund Society Fsb | $280,000 | Attorney | |
| Talia Athir F | $332,000 | First American Title Ins Co | |
| Signature Construction Inc | $288,000 | -- |
Source: Public Records
Mortgage History
| Date | Status | Borrower | Loan Amount |
|---|---|---|---|
| Previous Owner | Lulaj Rrok | $249,500 |
Source: Public Records
Tax History Compared to Growth
Tax History
| Year | Tax Paid | Tax Assessment Tax Assessment Total Assessment is a certain percentage of the fair market value that is determined by local assessors to be the total taxable value of land and additions on the property. | Land | Improvement |
|---|---|---|---|---|
| 2025 | $6,165 | $236,900 | $0 | $0 |
| 2024 | $4,724 | $229,500 | $0 | $0 |
| 2023 | $4,481 | $206,800 | $0 | $0 |
| 2022 | $5,584 | $184,100 | $0 | $0 |
| 2021 | $5,427 | $171,400 | $0 | $0 |
| 2020 | $4,111 | $167,900 | $0 | $0 |
| 2019 | $5,030 | $160,000 | $0 | $0 |
| 2018 | $4,733 | $156,200 | $0 | $0 |
| 2017 | $4,077 | $149,660 | $34,500 | $115,160 |
| 2016 | $7,941 | $149,660 | $0 | $0 |
| 2015 | $5,173 | $140,710 | $0 | $0 |
| 2014 | $5,173 | $122,840 | $23,500 | $99,340 |
| 2011 | $678 | $123,080 | $20,500 | $102,580 |
Source: Public Records
Map
Nearby Homes
- 20847 23 Mile Rd
- 46425 E Via Lucca Unit 12
- 21349 Course Dr
- 20488 W Kilburn Dr
- 20569 W Kilburn Dr
- 20505 W Kilburn Dr
- 50247 Cheltenham Dr
- 50635 Beckett Ct
- 20352 Banbury Ct
- 50696 Crusader Dr
- 50664 Crusader Dr
- 50632 Crusader Dr
- 50100 Victoria Place
- 21525 23 Mile Rd
- 50585 Crusader Dr
- 21478 Sabrina Dr
- 50617 Crusader Dr
- 50533 Crusader Dr
- 50600 Koss Dr
- 51412 Mauro Ln
- 50846 Nesting Ridge Dr
- 50782 Nesting Ridge Dr
- 50717 Nagy Ct
- 50749 Nagy Ct
- 50878 Nesting Ridge Dr
- 50685 Nagy Ct
- 50781 Nagy Ct
- 50829 Nesting Ridge Dr
- 50797 Nesting Ridge Dr
- 50861 Nesting Ridge Dr
- 50813 Nagy Ct
- 50910 Nesting Ridge Dr
- 50893 Nesting Ridge Dr
- 50748 Nesting Ridge Dr
- 50621 Nagy Ct
- 50774 Bredenbury Dr
- 50845 Nagy Ct
- 50802 Bredenbury Dr
- 50765 Nesting Ridge Dr
- 50938 Nesting Ridge Dr