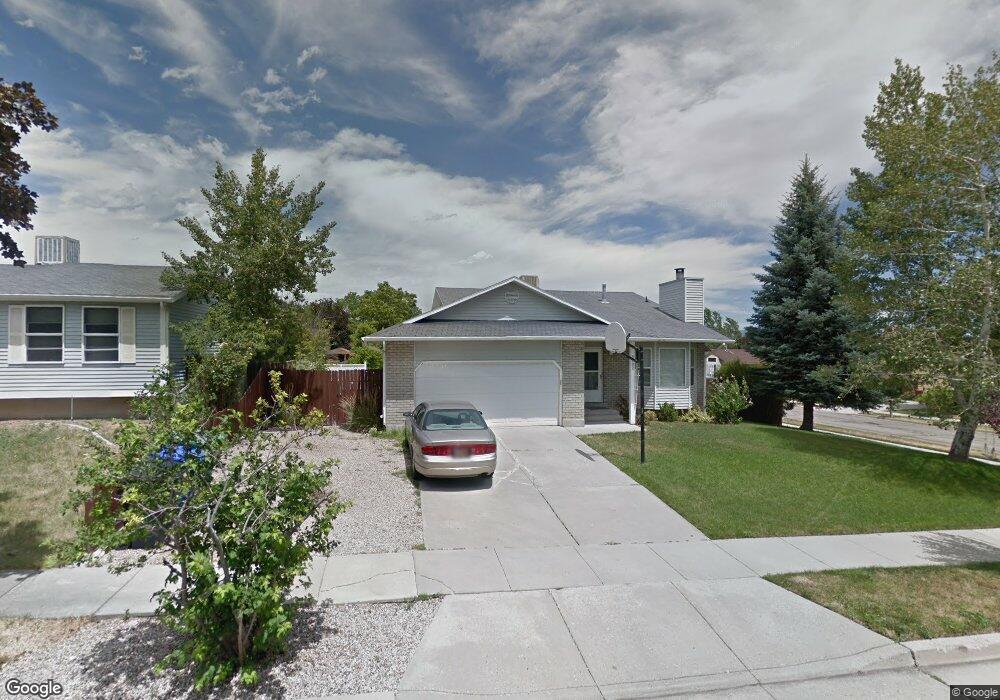
5082 Fuchsia Cir West Jordan, UT 84081
Oquirrh NeighborhoodEstimated Value: $456,000 - $487,000
4
Beds
2
Baths
1,872
Sq Ft
$252/Sq Ft
Est. Value
About This Home
This home is located at 5082 Fuchsia Cir, West Jordan, UT 84081 and is currently estimated at $471,104, approximately $251 per square foot. 5082 Fuchsia Cir is a home located in Salt Lake County with nearby schools including Jim Bridger Elementary School, Thomas Jefferson Jr High School, and Kearns High School.
Ownership History
Date
Name
Owned For
Owner Type
Purchase Details
Closed on
Apr 26, 2022
Sold by
Jensen Keith R
Bought by
Jensen Family Trust
Current Estimated Value
Purchase Details
Closed on
May 29, 2013
Sold by
Packard Aaron J and Packard Patricia M
Bought by
Jensen Keith R and Jensen Kirsten Lynn
Home Financials for this Owner
Home Financials are based on the most recent Mortgage that was taken out on this home.
Original Mortgage
$134,000
Interest Rate
2.6%
Mortgage Type
New Conventional
Purchase Details
Closed on
Dec 10, 2007
Sold by
Windsor Christopher D and Windsor Deborah L
Bought by
Packard Aaron J and Packard Patricia M
Home Financials for this Owner
Home Financials are based on the most recent Mortgage that was taken out on this home.
Original Mortgage
$9,377
Interest Rate
6.2%
Mortgage Type
Stand Alone Second
Create a Home Valuation Report for This Property
The Home Valuation Report is an in-depth analysis detailing your home's value as well as a comparison with similar homes in the area
Home Values in the Area
Average Home Value in this Area
Purchase History
| Date | Buyer | Sale Price | Title Company |
|---|---|---|---|
| Jensen Family Trust | -- | -- | |
| Jensen Keith R | -- | Title West | |
| Packard Aaron J | -- | United Title Services |
Source: Public Records
Mortgage History
| Date | Status | Borrower | Loan Amount |
|---|---|---|---|
| Previous Owner | Jensen Keith R | $134,000 | |
| Previous Owner | Packard Aaron J | $9,377 | |
| Previous Owner | Packard Aaron J | $196,811 |
Source: Public Records
Tax History Compared to Growth
Tax History
| Year | Tax Paid | Tax Assessment Tax Assessment Total Assessment is a certain percentage of the fair market value that is determined by local assessors to be the total taxable value of land and additions on the property. | Land | Improvement |
|---|---|---|---|---|
| 2025 | $2,675 | $446,600 | $133,600 | $313,000 |
| 2024 | $2,675 | $421,700 | $126,000 | $295,700 |
| 2023 | $2,645 | $397,100 | $121,100 | $276,000 |
| 2022 | $2,512 | $383,700 | $118,700 | $265,000 |
| 2021 | $2,330 | $316,300 | $91,300 | $225,000 |
| 2020 | $2,153 | $276,200 | $91,300 | $184,900 |
| 2019 | $2,116 | $263,700 | $86,200 | $177,500 |
| 2018 | $2,029 | $244,200 | $86,200 | $158,000 |
| 2017 | $1,719 | $217,700 | $86,200 | $131,500 |
| 2016 | $1,592 | $200,300 | $86,200 | $114,100 |
| 2015 | $1,585 | $185,600 | $82,500 | $103,100 |
| 2014 | $1,558 | $178,900 | $80,000 | $98,900 |
Source: Public Records
Map
Nearby Homes
- 6398 S Lobelia Dr
- 6437 S Lobelia Dr
- 6157 S Impressions Dr
- 4227 S Hopi Dr
- 5071 W Jarrad Rd
- 6568 S 5180 W
- 4909 Sakura Ct
- 5352 Cassatt Cir
- 6022 S Park Wood Dr W
- 5275 Ridge Flower Way
- 6489 S Daffodil Way
- 5382 W Northlilac Ave
- 5285 Ridge Flower Way
- 5183 W Cadenza Dr
- 6160 S Miramonte Way Unit T-30
- 6706 Marshrock Rd
- 5924 S Cami Dawn Ct
- 5960 S Tumerick Ct
- 4692 W Talavera Way
- 4690 W Miramonte Way #15 Way
- 5082 W Fuchsia Cir
- 5082 W Fuchsia Cir Unit 75
- 5094 Fuchsia Cir
- 5079 Cyclamen Way
- 5079 W Cyclamen Way
- 5091 Cyclamen Way
- 6343 S Fuchsia Dr
- 6343 Fuchsia Dr
- 6333 Fuchsia Dr
- 5100 W Fuchsia Cir
- 5100 Fuchsia Cir
- 6362 S Fuchsia Dr
- 6362 Fuchsia Dr
- 6353 S Fuchsia Dr
- 5093 Fuchsia Cir
- 6353 Fuchsia Dr
- 5059 W Cyclamen Way
- 5059 Cyclamen Way
- 5101 Cyclamen Way
- 5101 W Cyclamen Way