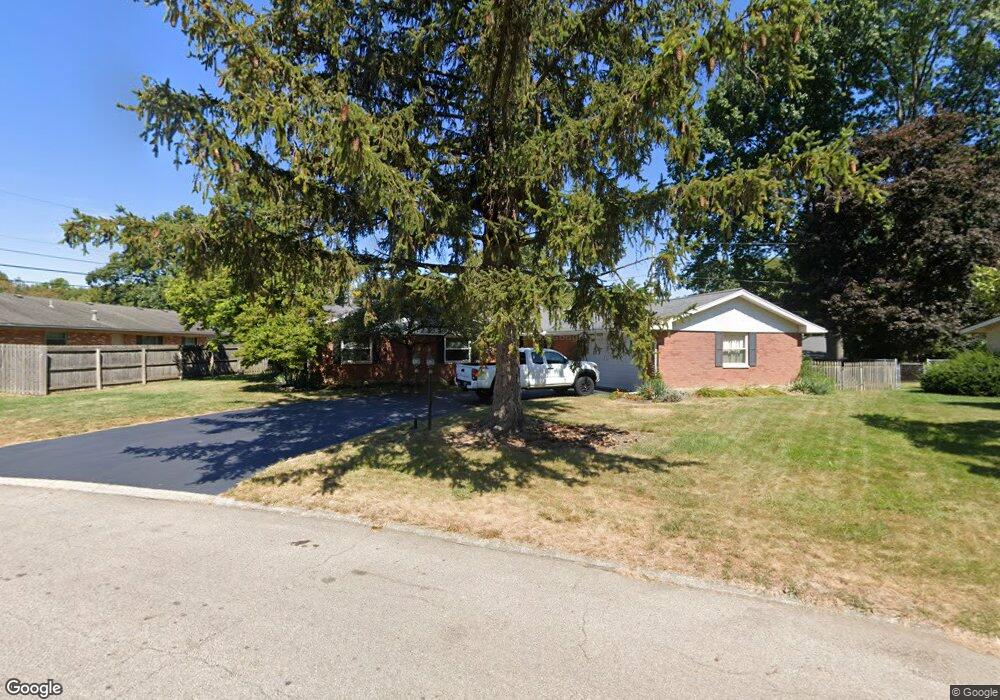
5084 Oak Tree Dr S Dayton, OH 45440
Estimated Value: $300,275 - $334,000
3
Beds
2
Baths
1,960
Sq Ft
$162/Sq Ft
Est. Value
About This Home
This home is located at 5084 Oak Tree Dr S, Dayton, OH 45440 and is currently estimated at $317,069, approximately $161 per square foot. 5084 Oak Tree Dr S is a home located in Montgomery County with nearby schools including John F. Kennedy Elementary School, Kettering Middle School, and Kettering Fairmont High School.
Ownership History
Date
Name
Owned For
Owner Type
Purchase Details
Closed on
Jun 27, 2008
Sold by
Damke Pradeep and Jones Luann D
Bought by
Damke Pradeep and Jones Luann D
Current Estimated Value
Purchase Details
Closed on
Feb 21, 2003
Sold by
Schaub Bonnie M and Schaub Bonnie M
Bought by
Damke Pradeep
Home Financials for this Owner
Home Financials are based on the most recent Mortgage that was taken out on this home.
Original Mortgage
$142,400
Interest Rate
6.07%
Purchase Details
Closed on
Sep 22, 1999
Sold by
Schaub Jerome L
Bought by
Schaub Bonnie M
Purchase Details
Closed on
Mar 18, 1999
Sold by
Thomas Steven P
Bought by
Schaub Jerome L and Schaub Bonnie M
Home Financials for this Owner
Home Financials are based on the most recent Mortgage that was taken out on this home.
Original Mortgage
$106,000
Interest Rate
6.8%
Purchase Details
Closed on
Nov 5, 1993
Sold by
Menker George T
Bought by
Thomas Steven P
Create a Home Valuation Report for This Property
The Home Valuation Report is an in-depth analysis detailing your home's value as well as a comparison with similar homes in the area
Home Values in the Area
Average Home Value in this Area
Purchase History
| Date | Buyer | Sale Price | Title Company |
|---|---|---|---|
| Damke Pradeep | -- | Attorney | |
| Damke Pradeep | $149,900 | -- | |
| Schaub Bonnie M | -- | -- | |
| Schaub Jerome L | $136,000 | Midland Title Security Inc | |
| Thomas Steven P | $129,900 | -- |
Source: Public Records
Mortgage History
| Date | Status | Borrower | Loan Amount |
|---|---|---|---|
| Closed | Damke Pradeep | $142,400 | |
| Previous Owner | Schaub Jerome L | $106,000 |
Source: Public Records
Tax History Compared to Growth
Tax History
| Year | Tax Paid | Tax Assessment Tax Assessment Total Assessment is a certain percentage of the fair market value that is determined by local assessors to be the total taxable value of land and additions on the property. | Land | Improvement |
|---|---|---|---|---|
| 2024 | $4,924 | $79,460 | $16,360 | $63,100 |
| 2023 | $4,924 | $79,460 | $16,360 | $63,100 |
| 2022 | $4,795 | $61,200 | $12,580 | $48,620 |
| 2021 | $4,434 | $61,200 | $12,580 | $48,620 |
| 2020 | $4,447 | $61,200 | $12,580 | $48,620 |
| 2019 | $4,578 | $55,710 | $12,580 | $43,130 |
| 2018 | $4,602 | $55,710 | $12,580 | $43,130 |
| 2017 | $4,238 | $55,710 | $12,580 | $43,130 |
| 2016 | $4,017 | $49,600 | $12,580 | $37,020 |
| 2015 | $3,837 | $49,600 | $12,580 | $37,020 |
| 2014 | $3,837 | $49,600 | $12,580 | $37,020 |
| 2012 | -- | $46,770 | $12,560 | $34,210 |
Source: Public Records
Map
Nearby Homes
- 2217 Westlawn Dr
- 2169 Broadbent Way
- 2184 Broadbent Way
- 1968 Carol Pkwy
- 5195 Bigger Rd
- 5173 Cloudsdale Dr
- 2405 Westlawn Dr
- 2386 E Rahn Rd
- 2360 E Rahn Rd
- 2318 E Rahn Rd
- 4824 Rean Meadow Dr
- 4508 Rean Meadow Dr
- 2313 Glenheath Dr
- 5335 Glendon Ln
- 5274 Millcreek Rd
- 5267 Newell Cir
- 4533 Drayton Ct
- 5052 Dobbs Dr
- 2648 Parklawn Dr
- 5324 Oakbrooke Dr
- 5072 Bigger Rd
- 5096 Oak Tree Dr S
- 2138 Belloak Dr
- 2150 Belloak Dr
- 5083 Oak Tree Dr S
- 5050 Bigger Rd
- 5074 Bigger Rd
- 5100 Oak Tree Dr S
- 2174 Belloak Dr
- 5109 Oak Tree Dr S
- 5110 Oak Tree Dr S
- 2137 Belloak Dr
- 5086 Bigger Rd
- 2149 Belloak Dr
- 2161 Belloak Dr
- 2186 Belloak Dr
- 2173 Belloak Dr
- 5121 Oak Tree Dr S
- 5122 Oak Tree Dr S
- 2125 Belloak Dr