Estimated Value: $525,000 - $581,448
3
Beds
3
Baths
3,064
Sq Ft
$183/Sq Ft
Est. Value
About This Home
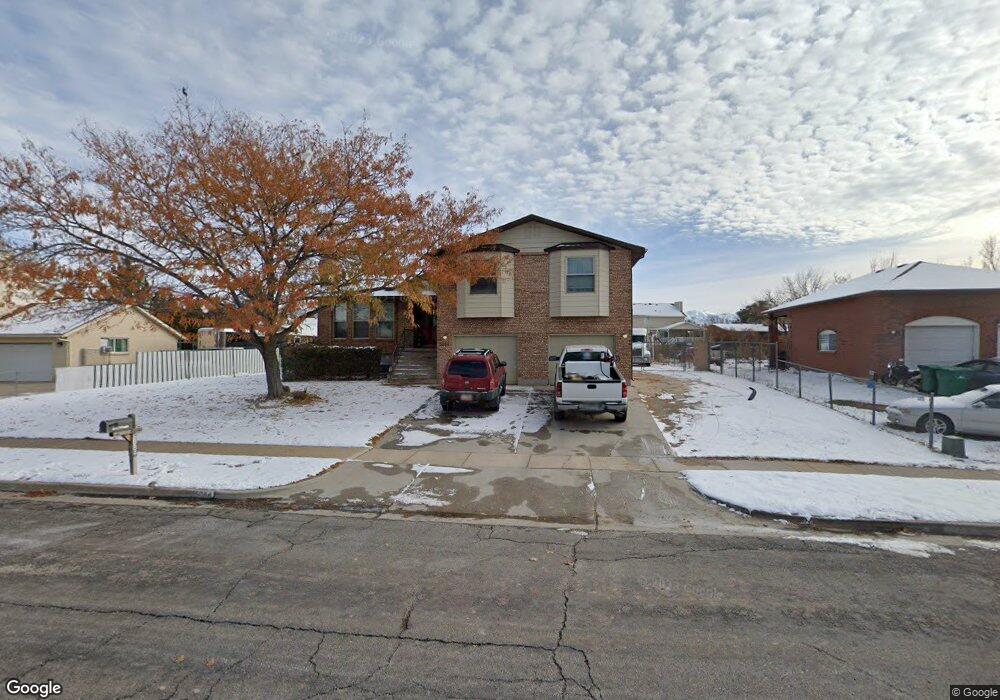
This home is located at 5084 S 3550 W, Roy, UT 84067 and is currently estimated at $561,112, approximately $183 per square foot. 5084 S 3550 W is a home located in Weber County with nearby schools including Municipal School, Roy Junior High School, and Roy High School.
Ownership History
Date
Name
Owned For
Owner Type
Purchase Details
Closed on
Dec 6, 2018
Sold by
Thompson Joel and Thompson Jacqueline
Bought by
Bateman Travis and Bateman Amanda
Current Estimated Value
Home Financials for this Owner
Home Financials are based on the most recent Mortgage that was taken out on this home.
Original Mortgage
$230,000
Outstanding Balance
$202,635
Interest Rate
4.8%
Mortgage Type
New Conventional
Estimated Equity
$358,477
Purchase Details
Closed on
Sep 8, 2017
Sold by
Thompson Joel
Bought by
Thompson Joel and Thompson Jacqueline
Home Financials for this Owner
Home Financials are based on the most recent Mortgage that was taken out on this home.
Original Mortgage
$240,000
Interest Rate
3.93%
Mortgage Type
New Conventional
Purchase Details
Closed on
Mar 22, 2012
Sold by
Federal Home Loan Mortgage Corporation
Bought by
Thompson Joel and Thompson Jaqueline
Home Financials for this Owner
Home Financials are based on the most recent Mortgage that was taken out on this home.
Original Mortgage
$177,555
Interest Rate
3.84%
Mortgage Type
New Conventional
Purchase Details
Closed on
Mar 20, 2012
Sold by
Branch Banking And Trust Co
Bought by
Federal Home Loan Mortgage Corporation
Home Financials for this Owner
Home Financials are based on the most recent Mortgage that was taken out on this home.
Original Mortgage
$177,555
Interest Rate
3.84%
Mortgage Type
New Conventional
Purchase Details
Closed on
Dec 28, 2011
Sold by
Clarke Jay G
Bought by
Branch Banking & Trust Company
Purchase Details
Closed on
May 24, 2010
Sold by
Clarke Jay G
Bought by
Clarke Jay G and Williams Darlene H
Home Financials for this Owner
Home Financials are based on the most recent Mortgage that was taken out on this home.
Original Mortgage
$180,000
Interest Rate
5.03%
Mortgage Type
New Conventional
Purchase Details
Closed on
May 4, 2010
Sold by
Clarke Jay G
Bought by
Clarke Jay G
Home Financials for this Owner
Home Financials are based on the most recent Mortgage that was taken out on this home.
Original Mortgage
$180,000
Interest Rate
5.03%
Mortgage Type
New Conventional
Purchase Details
Closed on
Jun 29, 2001
Sold by
Clarke Marilee
Bought by
Clarke Jay Glenn
Purchase Details
Closed on
May 19, 1999
Sold by
Clarke Jay G
Bought by
Clarke Jay G and Clarke Marilee F
Purchase Details
Closed on
Dec 9, 1998
Sold by
Clarke Jay G
Bought by
Clarke Jay G
Home Financials for this Owner
Home Financials are based on the most recent Mortgage that was taken out on this home.
Original Mortgage
$182,400
Interest Rate
6.78%
Mortgage Type
Purchase Money Mortgage
Create a Home Valuation Report for This Property
The Home Valuation Report is an in-depth analysis detailing your home's value as well as a comparison with similar homes in the area
Home Values in the Area
Average Home Value in this Area
Purchase History
| Date | Buyer | Sale Price | Title Company |
|---|---|---|---|
| Bateman Travis | -- | Mountain View Title Ogden | |
| Thompson Joel | -- | First American Title | |
| Thompson Joel | -- | First American Title Company | |
| Federal Home Loan Mortgage Corporation | -- | First American Title | |
| Branch Banking & Trust Company | -- | None Available | |
| Clarke Jay G | -- | Inwest Title Services Salt L | |
| Clarke Jay G | -- | Inwest Title Services Salt L | |
| Clarke Jay Glenn | -- | -- | |
| Clarke Jay G | -- | First American Title | |
| Clarke Jay G | -- | Associated Title |
Source: Public Records
Mortgage History
| Date | Status | Borrower | Loan Amount |
|---|---|---|---|
| Open | Bateman Travis | $230,000 | |
| Previous Owner | Thompson Joel | $240,000 | |
| Previous Owner | Thompson Joel | $177,555 | |
| Previous Owner | Clarke Jay G | $180,000 | |
| Previous Owner | Clarke Jay G | $182,400 |
Source: Public Records
Tax History Compared to Growth
Tax History
| Year | Tax Paid | Tax Assessment Tax Assessment Total Assessment is a certain percentage of the fair market value that is determined by local assessors to be the total taxable value of land and additions on the property. | Land | Improvement |
|---|---|---|---|---|
| 2025 | $3,547 | $563,365 | $138,345 | $425,020 |
| 2024 | $3,468 | $304,148 | $76,089 | $228,059 |
| 2023 | $3,042 | $264,550 | $75,583 | $188,967 |
| 2022 | $3,537 | $319,550 | $61,614 | $257,936 |
| 2021 | $3,055 | $454,000 | $86,479 | $367,521 |
| 2020 | $2,952 | $403,000 | $86,479 | $316,521 |
| 2019 | $2,464 | $313,000 | $42,951 | $270,049 |
| 2018 | $2,404 | $304,000 | $42,951 | $261,049 |
| 2017 | $2,194 | $267,000 | $48,167 | $218,833 |
| 2016 | $1,985 | $129,271 | $25,035 | $104,236 |
| 2015 | $1,789 | $114,149 | $25,035 | $89,114 |
| 2014 | $1,789 | $111,811 | $25,035 | $86,776 |
Source: Public Records
Map
Nearby Homes
- 3443 W 5200 S Unit 2&3
- 3509 W 4835 S Unit 26
- 3523 W 4835 S Unit 28
- 3524 W 4835 S Unit 22
- Poplar Plan at Highgate Cove
- Pando Plan at Highgate Cove
- 4964 S 3375 W
- 3820 Foxglen Dr
- 3766 W 5300 S
- 3607 W 5400 S
- 3671 W 4700 S
- 3627 W 4650 S
- 5235 Midland Dr
- 3632 W 4650 S
- 3669 W 4625 S
- 5321 S 3100 W
- 3652 W 4625 S
- 3692 W 4625 S
- 4021 W 5000 S
- 5578 S 3450 W