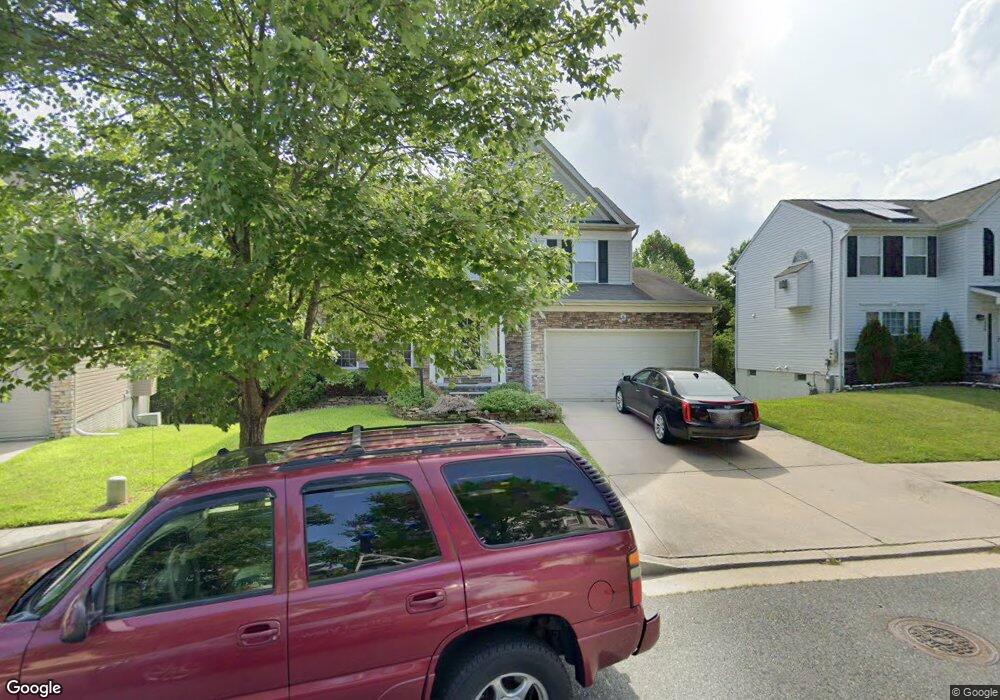
5084 Springhouse Cir Rosedale, MD 21237
Estimated Value: $498,000 - $598,000
5
Beds
4
Baths
3,086
Sq Ft
$183/Sq Ft
Est. Value
About This Home
This home is located at 5084 Springhouse Cir, Rosedale, MD 21237 and is currently estimated at $564,425, approximately $182 per square foot. 5084 Springhouse Cir is a home located in Baltimore County with nearby schools including Parkville Middle & Center of Technology, Overlea High School, and Rosedale Baptist School.
Ownership History
Date
Name
Owned For
Owner Type
Purchase Details
Closed on
Nov 5, 2008
Sold by
Betts Kimberly A
Bought by
Spence Rhonda L and Pugh Shirley D
Current Estimated Value
Home Financials for this Owner
Home Financials are based on the most recent Mortgage that was taken out on this home.
Original Mortgage
$428,614
Outstanding Balance
$285,902
Interest Rate
6.41%
Mortgage Type
FHA
Estimated Equity
$278,523
Purchase Details
Closed on
Oct 2, 2008
Sold by
Betts Kimberly A
Bought by
Spence Rhonda L and Pugh Shirley D
Home Financials for this Owner
Home Financials are based on the most recent Mortgage that was taken out on this home.
Original Mortgage
$428,614
Outstanding Balance
$285,902
Interest Rate
6.41%
Mortgage Type
FHA
Estimated Equity
$278,523
Purchase Details
Closed on
Nov 15, 1999
Sold by
Springhouse Landmark Inc
Bought by
Betts Kimberly A
Purchase Details
Closed on
Jun 24, 1999
Sold by
Shirleybrook Development Corp
Bought by
Springhouse Landmark Inc
Create a Home Valuation Report for This Property
The Home Valuation Report is an in-depth analysis detailing your home's value as well as a comparison with similar homes in the area
Home Values in the Area
Average Home Value in this Area
Purchase History
| Date | Buyer | Sale Price | Title Company |
|---|---|---|---|
| Spence Rhonda L | $432,000 | -- | |
| Spence Rhonda L | $432,000 | -- | |
| Betts Kimberly A | $75,050 | -- | |
| Springhouse Landmark Inc | $73,075 | -- |
Source: Public Records
Mortgage History
| Date | Status | Borrower | Loan Amount |
|---|---|---|---|
| Open | Spence Rhonda L | $428,614 | |
| Closed | Spence Rhonda L | $428,614 |
Source: Public Records
Tax History Compared to Growth
Tax History
| Year | Tax Paid | Tax Assessment Tax Assessment Total Assessment is a certain percentage of the fair market value that is determined by local assessors to be the total taxable value of land and additions on the property. | Land | Improvement |
|---|---|---|---|---|
| 2025 | $5,879 | $447,200 | -- | -- |
| 2024 | $5,879 | $411,800 | $0 | $0 |
| 2023 | $2,736 | $376,400 | $126,900 | $249,500 |
| 2022 | $5,338 | $369,867 | $0 | $0 |
| 2021 | $5,386 | $363,333 | $0 | $0 |
| 2020 | $5,386 | $356,800 | $126,900 | $229,900 |
| 2019 | $5,271 | $352,400 | $0 | $0 |
| 2018 | $5,004 | $348,000 | $0 | $0 |
| 2017 | $5,041 | $343,600 | $0 | $0 |
| 2016 | $5,186 | $320,333 | $0 | $0 |
| 2015 | $5,186 | $297,067 | $0 | $0 |
| 2014 | $5,186 | $273,800 | $0 | $0 |
Source: Public Records
Map
Nearby Homes
- 4930 Ridge Rd
- 5108 Windermere Cir
- 1 Comes Ridge Ct
- 2 Comes Ridge Ct
- 5027 Bridgeford Cir
- 4 Comes Ridge Ct
- 4 Comes Ridge Ct
- 6 Comes Ridge Ct
- 7 Comes Ridge Ct
- 4812 Ridge Rd
- 4743 Ridge Rd
- 5034 Silver Oak Dr
- 5044 Silver Oak Dr
- 5046 Silver Oak Dr
- 5048 Silver Oak Dr
- 5144 Brightleaf Ct
- 5240 King Ave
- 4832 Brightleaf Ct
- 9534 Shirewood Ct
- 5085 Silver Oak Dr
- 5082 Springhouse Cir
- 5086 Springhouse Cir
- 5080 Springhouse Cir
- 5073 Springhouse Cir
- 5069 Springhouse Cir
- 5075 Springhouse Cir
- 5078 Springhouse Cir
- 5067 Springhouse Cir
- 5076 Springhouse Cir
- 5013 Springhouse Cir
- 5010 Springhouse Cir
- 5065 Springhouse Cir
- 5074 Springhouse Cir
- 5012 Springhouse Cir
- 5072 Springhouse Cir
- 5063 Springhouse Cir
- 7932 McNeal Farm Cir
- 5068 Springhouse Cir
- 5014 Springhouse Cir
- 7806 Reston Ln