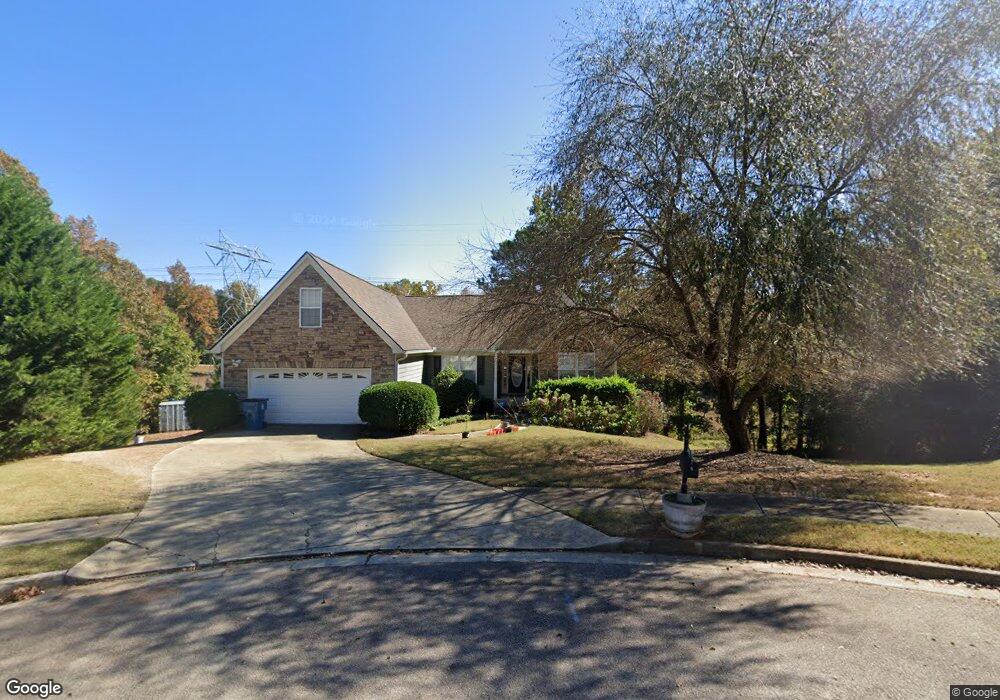
5086 Marsh Creek Ct Braselton, GA 30517
Estimated Value: $424,000 - $473,853
3
Beds
3
Baths
2,942
Sq Ft
$154/Sq Ft
Est. Value
About This Home
This home is located at 5086 Marsh Creek Ct, Braselton, GA 30517 and is currently estimated at $451,963, approximately $153 per square foot. 5086 Marsh Creek Ct is a home with nearby schools including Chestnut Mountain Elementary School, Cherokee Bluff Middle School, and Cherokee Bluff High School.
Ownership History
Date
Name
Owned For
Owner Type
Purchase Details
Closed on
Mar 23, 2018
Sold by
Greenlee Brooke
Bought by
Greenlee Greg
Current Estimated Value
Home Financials for this Owner
Home Financials are based on the most recent Mortgage that was taken out on this home.
Original Mortgage
$192,000
Outstanding Balance
$163,889
Interest Rate
4.4%
Mortgage Type
New Conventional
Estimated Equity
$288,074
Purchase Details
Closed on
Oct 17, 2003
Sold by
Riverside Homebuilders Llc
Bought by
Greenlee Greg and Greenlee Brooke
Home Financials for this Owner
Home Financials are based on the most recent Mortgage that was taken out on this home.
Original Mortgage
$167,724
Interest Rate
6.03%
Mortgage Type
New Conventional
Purchase Details
Closed on
May 9, 2002
Sold by
Riverside Management Corp
Bought by
Riverside Homebuilders Llc
Purchase Details
Closed on
Sep 28, 2001
Sold by
Lanier Development Group
Bought by
Autumn Ridge Builders Group Inc
Create a Home Valuation Report for This Property
The Home Valuation Report is an in-depth analysis detailing your home's value as well as a comparison with similar homes in the area
Home Values in the Area
Average Home Value in this Area
Purchase History
| Date | Buyer | Sale Price | Title Company |
|---|---|---|---|
| Greenlee Greg | -- | -- | |
| Greenlee Greg | $169,900 | -- | |
| Riverside Homebuilders Llc | $180,000 | -- | |
| Autumn Ridge Builders Group Inc | $1,590,000 | -- |
Source: Public Records
Mortgage History
| Date | Status | Borrower | Loan Amount |
|---|---|---|---|
| Open | Greenlee Greg | $192,000 | |
| Previous Owner | Greenlee Greg | $167,724 |
Source: Public Records
Tax History Compared to Growth
Tax History
| Year | Tax Paid | Tax Assessment Tax Assessment Total Assessment is a certain percentage of the fair market value that is determined by local assessors to be the total taxable value of land and additions on the property. | Land | Improvement |
|---|---|---|---|---|
| 2024 | $4,514 | $178,680 | $26,960 | $151,720 |
| 2023 | $3,971 | $172,320 | $26,960 | $145,360 |
| 2022 | $4,027 | $152,520 | $26,960 | $125,560 |
| 2021 | $3,366 | $124,480 | $13,480 | $111,000 |
| 2020 | $3,163 | $113,480 | $13,480 | $100,000 |
| 2019 | $3,138 | $111,600 | $10,560 | $101,040 |
| 2018 | $3,125 | $107,560 | $10,560 | $97,000 |
Source: Public Records
Map
Nearby Homes
- 5120 Daylily Dr
- 0 Highway 53 Unit 10606336
- 4404 Tanners Mill Rd
- 5420 Planting Field Ln
- 5427 Planting Field Ln
- 5329 Retreat Dr
- 5356 Retreat Dr
- 5377 Retreat Dr
- 5392 Retreat Dr
- 5306 Weeping Creek Trail
- 5313 Founders Way Unit 36
- 5313 Founders Way
- 5314 Founders Way
- 5314 Founders Way Unit 35
- 5309 Founders Way
- 5214 Nimble Wood Way
- 5346 Robin Trail
- 2794 Cork St
- 5087 Marsh Creek Ct
- 5082 Marsh Creek Ct
- 5083 Marsh Creek Ct
- 5078 Marsh Creek Ct
- 5075 Marsh Creek Ct
- 5019 Daylily Dr
- 5074 Marsh Creek Ct
- 5031 Daylily Dr
- 5007 Daylily Dr
- 5065 Marsh Creek Ct
- 5037 Daylily Dr
- 5068 Marsh Creek Ct
- 0 Daylily Dr Unit 8500757
- 0 Daylily Dr Unit 8619277
- 0 Daylily Dr Unit 7377262
- 0 Daylily Dr Unit 8707034
- 0 Daylily Dr Unit 8436647
- 0 Daylily Dr Unit 8674797
- 0 Daylily Dr Unit 8949707
- 0 Daylily Dr Unit 8896578