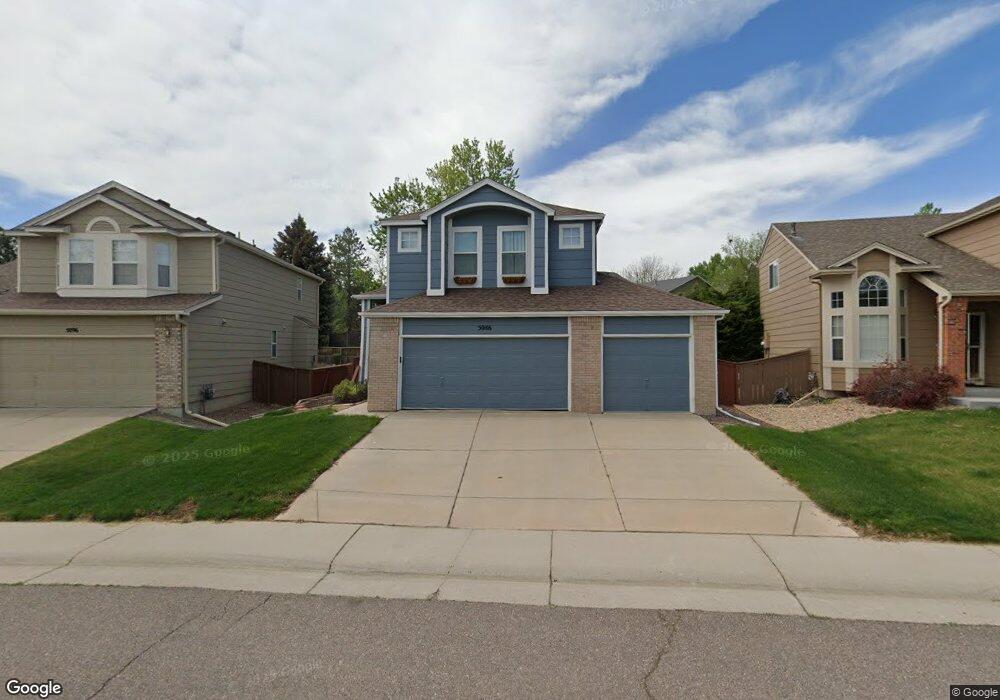
5086 Weeping Willow Cir Highlands Ranch, CO 80130
Eastridge NeighborhoodEstimated Value: $644,000 - $666,000
3
Beds
4
Baths
1,810
Sq Ft
$361/Sq Ft
Est. Value
About This Home
This home is located at 5086 Weeping Willow Cir, Highlands Ranch, CO 80130 and is currently estimated at $653,482, approximately $361 per square foot. 5086 Weeping Willow Cir is a home located in Douglas County with nearby schools including Fox Creek Elementary School, Cresthill Middle School, and Highlands Ranch High School.
Ownership History
Date
Name
Owned For
Owner Type
Purchase Details
Closed on
Nov 7, 2011
Sold by
Saupe Lyndie and Saupe Brian D
Bought by
Saupe Lyndie
Current Estimated Value
Home Financials for this Owner
Home Financials are based on the most recent Mortgage that was taken out on this home.
Original Mortgage
$254,000
Outstanding Balance
$174,204
Interest Rate
4.14%
Mortgage Type
New Conventional
Estimated Equity
$479,278
Purchase Details
Closed on
Nov 2, 2011
Sold by
Saupe Lyndie
Bought by
Saupe Lyndie and Saupe Brian P
Home Financials for this Owner
Home Financials are based on the most recent Mortgage that was taken out on this home.
Original Mortgage
$254,000
Outstanding Balance
$174,204
Interest Rate
4.14%
Mortgage Type
New Conventional
Estimated Equity
$479,278
Purchase Details
Closed on
Oct 25, 2011
Sold by
Saupe Lyndie
Bought by
Saupe Lyndie and Saupe Brian
Home Financials for this Owner
Home Financials are based on the most recent Mortgage that was taken out on this home.
Original Mortgage
$254,000
Outstanding Balance
$174,204
Interest Rate
4.14%
Mortgage Type
New Conventional
Estimated Equity
$479,278
Purchase Details
Closed on
Nov 16, 2006
Sold by
Saupe Lyndie and Saupe Brian
Bought by
Saupe Lyndie
Home Financials for this Owner
Home Financials are based on the most recent Mortgage that was taken out on this home.
Original Mortgage
$261,000
Interest Rate
6.37%
Mortgage Type
New Conventional
Purchase Details
Closed on
Oct 31, 2006
Sold by
Saupe Lyndie
Bought by
Saupe Lyndie and Saupe Brian
Home Financials for this Owner
Home Financials are based on the most recent Mortgage that was taken out on this home.
Original Mortgage
$261,000
Interest Rate
6.37%
Mortgage Type
New Conventional
Purchase Details
Closed on
Jun 26, 2001
Sold by
Saupe Brian
Bought by
Saupe Lyndie
Home Financials for this Owner
Home Financials are based on the most recent Mortgage that was taken out on this home.
Original Mortgage
$204,500
Interest Rate
7.16%
Purchase Details
Closed on
Jun 25, 2001
Sold by
Saupe Brian and Saupe Lyndie
Bought by
Saupe Lyndie
Home Financials for this Owner
Home Financials are based on the most recent Mortgage that was taken out on this home.
Original Mortgage
$204,500
Interest Rate
7.16%
Purchase Details
Closed on
Apr 29, 1994
Sold by
Richmond Homes Inc Ii
Bought by
Saupe Brian and Saupe Lyndie
Home Financials for this Owner
Home Financials are based on the most recent Mortgage that was taken out on this home.
Original Mortgage
$131,436
Interest Rate
7.71%
Purchase Details
Closed on
Jul 14, 1993
Sold by
Mission Viejo Co
Bought by
Richmond Homes Inc Ii
Create a Home Valuation Report for This Property
The Home Valuation Report is an in-depth analysis detailing your home's value as well as a comparison with similar homes in the area
Home Values in the Area
Average Home Value in this Area
Purchase History
| Date | Buyer | Sale Price | Title Company |
|---|---|---|---|
| Saupe Lyndie | -- | Capital Title Llc | |
| Saupe Lyndie | -- | None Available | |
| Saupe Lyndie | -- | -- | |
| Saupe Lyndie | -- | None Available | |
| Saupe Lyndie | -- | None Available | |
| Saupe Lyndie | -- | Chicago Title Co | |
| Saupe Lyndie | -- | -- | |
| Saupe Brian | $146,040 | Land Title | |
| Richmond Homes Inc Ii | $179,200 | -- |
Source: Public Records
Mortgage History
| Date | Status | Borrower | Loan Amount |
|---|---|---|---|
| Open | Saupe Lyndie | $254,000 | |
| Previous Owner | Saupe Lyndie | $261,000 | |
| Previous Owner | Saupe Lyndie | $204,500 | |
| Previous Owner | Saupe Brian | $131,436 |
Source: Public Records
Tax History Compared to Growth
Tax History
| Year | Tax Paid | Tax Assessment Tax Assessment Total Assessment is a certain percentage of the fair market value that is determined by local assessors to be the total taxable value of land and additions on the property. | Land | Improvement |
|---|---|---|---|---|
| 2024 | $4,049 | $46,640 | $10,170 | $36,470 |
| 2023 | $4,042 | $46,640 | $10,170 | $36,470 |
| 2022 | $3,020 | $33,060 | $6,940 | $26,120 |
| 2021 | $3,141 | $33,060 | $6,940 | $26,120 |
| 2020 | $3,041 | $32,790 | $6,630 | $26,160 |
| 2019 | $3,052 | $32,790 | $6,630 | $26,160 |
| 2018 | $2,641 | $27,950 | $5,800 | $22,150 |
| 2017 | $2,405 | $27,950 | $5,800 | $22,150 |
| 2016 | $2,201 | $25,100 | $5,430 | $19,670 |
| 2015 | $2,248 | $25,100 | $5,430 | $19,670 |
| 2014 | $2,005 | $20,670 | $5,330 | $15,340 |
Source: Public Records
Map
Nearby Homes
- 5055 Weeping Willow Cir
- 9382 Morning Glory Ln
- 5329 Morning Glory Place
- 9224 Weeping Willow Place
- 9222 Buttonhill Ct
- 5322 Shetland Ct
- 9678 Rockhampton Way
- 9254 Lark Sparrow Dr
- 6 Abernathy Ct
- 9634 Merimbula St
- 9602 Townsville Cir
- 9720 Sydney Ln
- 9346 Lark Sparrow Dr
- 8951 Greenwich St
- 5126 Tuscany Ct
- 4927 Greenwich Way
- 9325 Lark Sparrow Dr
- 14 Stonehaven Ct
- 8925 Copeland St
- 6340 Ashburn Ln
- 5096 Weeping Willow Cir
- 5076 Weeping Willow Cir
- 5270 Morning Glory Place
- 5066 Weeping Willow Cir
- 5106 Weeping Willow Cir
- 5250 Morning Glory Place
- 5280 Morning Glory Place
- 5095 Weeping Willow Cir
- 5056 Weeping Willow Cir
- 5116 Weeping Willow Cir
- 5240 Morning Glory Place
- 5085 Weeping Willow Cir
- 5105 Weeping Willow Cir
- 5290 Morning Glory Place
- 5046 Weeping Willow Cir
- 5125 Weeping Willow Cir
- 5230 Morning Glory Place
- 5126 Weeping Willow Cir
- 9374 Morning Glory Ln
- 9378 Morning Glory Ln