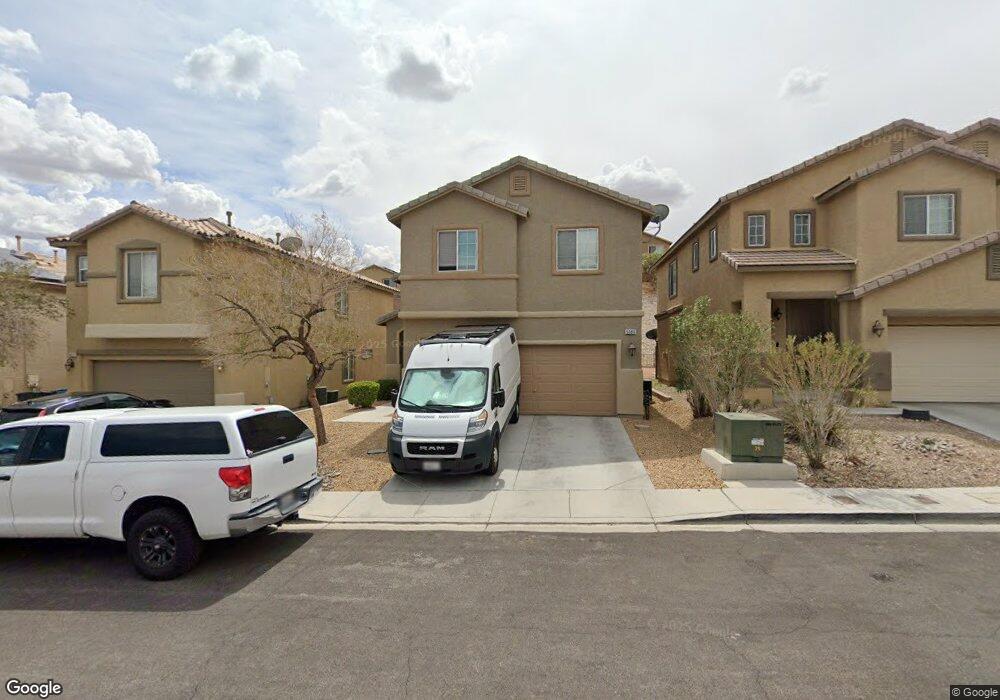
5089 Ivy Creek Ct Unit n/a Las Vegas, NV 89141
Southern Highlands NeighborhoodEstimated Value: $450,977
3
Beds
3
Baths
1,567
Sq Ft
$288/Sq Ft
Est. Value
About This Home
This home is located at 5089 Ivy Creek Ct Unit n/a, Las Vegas, NV 89141 and is currently priced at $450,977, approximately $287 per square foot. 5089 Ivy Creek Ct Unit n/a is a home located in Clark County with nearby schools including Evelyn Stuckey Elementary School, Lois & Jerry Tarkanian Middle School, and Desert Oasis High School.
Ownership History
Date
Name
Owned For
Owner Type
Purchase Details
Closed on
Apr 24, 2013
Sold by
Bond Jaime D Hughett and Hughett Jaime D
Bought by
Shimabukuro Crystal B J
Current Estimated Value
Home Financials for this Owner
Home Financials are based on the most recent Mortgage that was taken out on this home.
Original Mortgage
$112,000
Outstanding Balance
$78,978
Interest Rate
3.6%
Mortgage Type
New Conventional
Purchase Details
Closed on
Jun 20, 2005
Sold by
Star Hill Llc
Bought by
Hughett James D
Home Financials for this Owner
Home Financials are based on the most recent Mortgage that was taken out on this home.
Original Mortgage
$328,000
Interest Rate
5.72%
Mortgage Type
Fannie Mae Freddie Mac
Create a Home Valuation Report for This Property
The Home Valuation Report is an in-depth analysis detailing your home's value as well as a comparison with similar homes in the area
Home Values in the Area
Average Home Value in this Area
Purchase History
| Date | Buyer | Sale Price | Title Company |
|---|---|---|---|
| Shimabukuro Crystal B J | $140,000 | Equity Title Of Nevada | |
| Bond Jaime D Hughett | -- | Equity Title Of Nevada | |
| Hughett James D | $345,290 | Chicago Title |
Source: Public Records
Mortgage History
| Date | Status | Borrower | Loan Amount |
|---|---|---|---|
| Open | Shimabukuro Crystal B J | $112,000 | |
| Previous Owner | Hughett James D | $328,000 |
Source: Public Records
Tax History Compared to Growth
Tax History
| Year | Tax Paid | Tax Assessment Tax Assessment Total Assessment is a certain percentage of the fair market value that is determined by local assessors to be the total taxable value of land and additions on the property. | Land | Improvement |
|---|---|---|---|---|
| 2025 | $2,076 | $108,681 | $38,150 | $70,531 |
| 2024 | $1,922 | $108,681 | $38,150 | $70,531 |
| 2023 | $1,280 | $101,582 | $35,000 | $66,582 |
| 2022 | $1,780 | $87,307 | $26,600 | $60,707 |
| 2021 | $1,649 | $82,544 | $24,850 | $57,694 |
| 2020 | $1,528 | $81,225 | $24,150 | $57,075 |
| 2019 | $1,432 | $76,338 | $20,300 | $56,038 |
| 2018 | $1,366 | $71,217 | $17,500 | $53,717 |
| 2017 | $2,055 | $70,038 | $15,750 | $54,288 |
| 2016 | $1,280 | $66,274 | $12,250 | $54,024 |
| 2015 | $1,277 | $48,131 | $8,750 | $39,381 |
| 2014 | $1,237 | $42,396 | $6,650 | $35,746 |
Source: Public Records
Map
Nearby Homes
- 5100 Ivy Creek Ct
- 5055 Quiet Falls Ct
- 5018 Quiet Falls Ct
- 11148 Star Lily St
- 11024 Vallerosa St
- 11063 Gagliano St
- 5147 Echo Shire Ave
- 5053 Benezette Ct
- 5310 Esparon Ave
- 11076 Zampino St
- 0 Starr Hills Ave Unit 2535931
- 10960 Bethel Park Ct
- 5220 Melbourne Ridge Ct
- 5214 Melbourne Ridge Ct
- 11239 Castellane Dr
- 11152 Montagne Marron Blvd
- 4997 Graziano Ave
- 5567 Cortu Ave
- 11145 Montagne Marron Blvd
- 5070 Masotta Ave
- 5089 Ivy Creek Ct
- 5077 Ivy Creek Ct
- 5101 Ivy Creek Ct
- 5077R Ivy Creek Ct
- 5065 Ivy Creek Ct
- 5113 Ivy Creek Ct
- 5053 Ivy Creek Ct Unit 1
- 5125 Ivy Creek Ct
- 5090 Quiet Falls Ct Unit 1
- 5102 Quiet Falls Ct
- 5066 Quiet Falls Ct
- 5114 Quiet Falls Ct
- 5041 Ivy Creek Ct
- 5054 Quiet Falls Ct
- 5088 Ivy Creek Ct
- 5076 Ivy Creek Ct
- 5126 Quiet Falls Ct
- 5064 Ivy Creek Ct
- 5112 Ivy Creek Ct