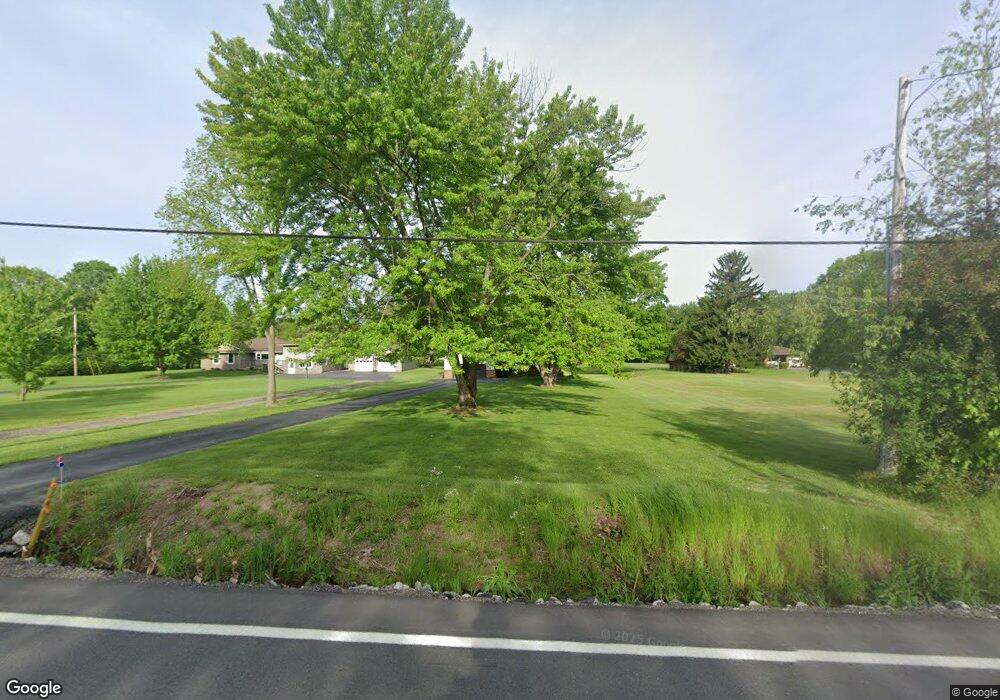
5089 State Route 46 Cortland, OH 44410
Estimated Value: $202,000 - $299,000
3
Beds
1
Bath
1,163
Sq Ft
$209/Sq Ft
Est. Value
About This Home
This home is located at 5089 State Route 46, Cortland, OH 44410 and is currently estimated at $243,225, approximately $209 per square foot. 5089 State Route 46 is a home located in Trumbull County with nearby schools including Maplewood Middle School, Maplewood Elementary School, and Maplewood High School.
Ownership History
Date
Name
Owned For
Owner Type
Purchase Details
Closed on
Oct 12, 2017
Sold by
Shipman Greg and Shipman Richelle D
Bought by
Wazelle John A
Current Estimated Value
Home Financials for this Owner
Home Financials are based on the most recent Mortgage that was taken out on this home.
Original Mortgage
$104,000
Outstanding Balance
$86,869
Interest Rate
3.82%
Mortgage Type
New Conventional
Estimated Equity
$156,356
Purchase Details
Closed on
Sep 16, 2014
Sold by
Clark Carl W and Clark Carl
Bought by
Shipman Greg and Shipman Richelle D
Home Financials for this Owner
Home Financials are based on the most recent Mortgage that was taken out on this home.
Original Mortgage
$123,500
Interest Rate
4.15%
Mortgage Type
New Conventional
Purchase Details
Closed on
Oct 17, 2012
Sold by
Clark Heather
Bought by
Clark Carl W
Purchase Details
Closed on
Jan 1, 1990
Bought by
Heather Clark
Create a Home Valuation Report for This Property
The Home Valuation Report is an in-depth analysis detailing your home's value as well as a comparison with similar homes in the area
Home Values in the Area
Average Home Value in this Area
Purchase History
| Date | Buyer | Sale Price | Title Company |
|---|---|---|---|
| Wazelle John A | $130,000 | None Available | |
| Shipman Greg | $130,000 | None Available | |
| Clark Carl W | -- | None Available | |
| Heather Clark | -- | -- |
Source: Public Records
Mortgage History
| Date | Status | Borrower | Loan Amount |
|---|---|---|---|
| Open | Wazelle John A | $104,000 | |
| Previous Owner | Shipman Greg | $123,500 |
Source: Public Records
Tax History Compared to Growth
Tax History
| Year | Tax Paid | Tax Assessment Tax Assessment Total Assessment is a certain percentage of the fair market value that is determined by local assessors to be the total taxable value of land and additions on the property. | Land | Improvement |
|---|---|---|---|---|
| 2024 | $2,614 | $61,990 | $12,040 | $49,950 |
| 2023 | $2,614 | $61,990 | $12,040 | $49,950 |
| 2022 | $2,175 | $50,160 | $11,170 | $38,990 |
| 2021 | $2,294 | $50,160 | $11,170 | $38,990 |
| 2020 | $2,245 | $50,160 | $11,170 | $38,990 |
| 2019 | $2,150 | $45,790 | $10,330 | $35,460 |
| 2018 | $2,137 | $45,790 | $10,330 | $35,460 |
| 2017 | $2,185 | $45,790 | $10,330 | $35,460 |
| 2016 | $1,982 | $41,620 | $9,350 | $32,270 |
| 2015 | $1,924 | $41,620 | $9,350 | $32,270 |
| 2014 | $1,917 | $41,620 | $9,350 | $32,270 |
| 2013 | $1,966 | $41,620 | $9,350 | $32,270 |
Source: Public Records
Map
Nearby Homes
- 4869 Phillips Rice Rd
- 507 Tournament Trail
- 400 Tournament Trail Unit 400
- 101 Elizabeth Ct
- 121 Fairway Dr
- 525 Sycamore Trail
- 0 N High St
- 428 Cherry Hill Ln
- 404 Cherry Hill Ln
- 5294 Cottage Dr
- 163 N Mecca St Unit 167
- 2684 Griffith Dr
- 155 Heritage Ln
- 0 St Andrews Unit 5113795
- 160 Saint Andrews
- 20 Harneds Landing Unit 20
- 167 S Mecca St
- 124 Saint Andrews
- 6101 Private
- 278 Rosewae Ave
- 5073 State Route 46
- 5099 State Route 46
- 5059 State Route 46
- 5109 State Route 46
- 5119 State Route 46
- 5049 State Route 46
- 5074 State Route 46
- 5074 State Route 46
- 5043 State Route 46
- 5116 State Route 46
- 5031 State Route 46
- 5144 State Route 46
- 5017 State Route 46
- 5028 State Route 46
- 5007 State Route 46
- 4988 State Route 46
- 4987 State Route 46
- 4979 State Route 46
- 4963 McCleary Jacoby Rd
- 4949 McCleary Jacoby Rd