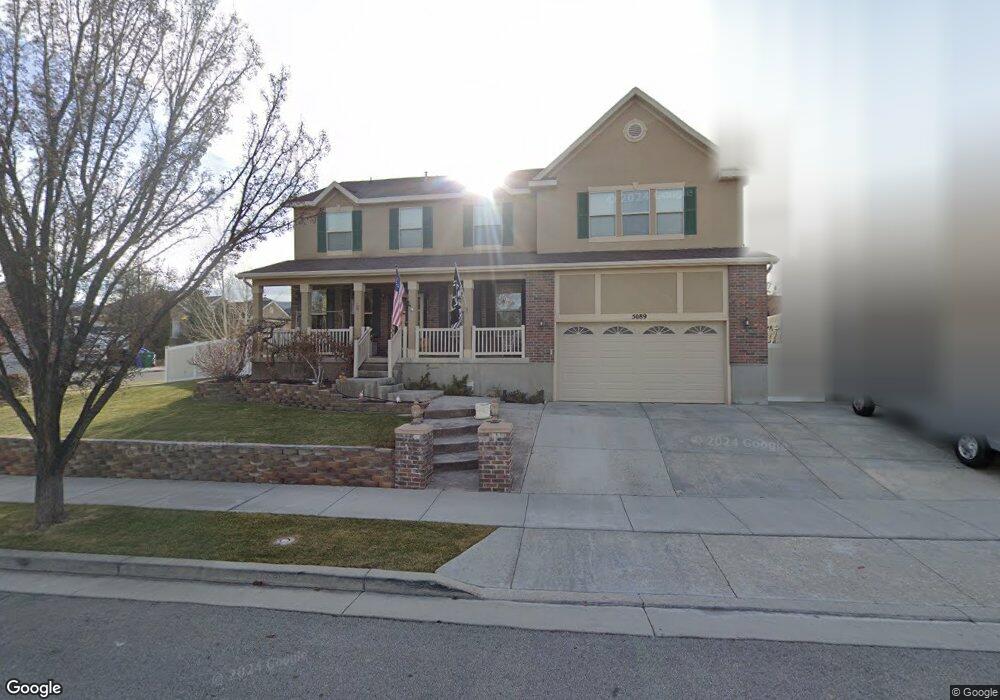
5089 W Buckeye View Way Riverton, UT 84096
Estimated Value: $610,000 - $742,000
4
Beds
3
Baths
2,823
Sq Ft
$241/Sq Ft
Est. Value
About This Home
This home is located at 5089 W Buckeye View Way, Riverton, UT 84096 and is currently estimated at $680,523, approximately $241 per square foot. 5089 W Buckeye View Way is a home located in Salt Lake County with nearby schools including Foothills School, South Hills Middle School, and Mountain Ridge High School.
Ownership History
Date
Name
Owned For
Owner Type
Purchase Details
Closed on
Mar 4, 2021
Sold by
Jaroscak Deborah L and Jaroscak Paul S
Bought by
Jaroscak Paul S and Jaroscak Deborah L
Current Estimated Value
Home Financials for this Owner
Home Financials are based on the most recent Mortgage that was taken out on this home.
Original Mortgage
$205,000
Outstanding Balance
$119,551
Interest Rate
2.7%
Mortgage Type
New Conventional
Estimated Equity
$560,972
Purchase Details
Closed on
Feb 25, 2020
Sold by
Jaroscak Paul S and Jaroscak Deborah L
Bought by
Jaroscak Paul S and Jaroscak Deborah L
Purchase Details
Closed on
Mar 16, 2005
Sold by
Richmond American Homes
Bought by
Jaroscak Paul S and Jaroscak Deborah L
Home Financials for this Owner
Home Financials are based on the most recent Mortgage that was taken out on this home.
Original Mortgage
$28,554
Interest Rate
5.6%
Mortgage Type
Unknown
Create a Home Valuation Report for This Property
The Home Valuation Report is an in-depth analysis detailing your home's value as well as a comparison with similar homes in the area
Home Values in the Area
Average Home Value in this Area
Purchase History
| Date | Buyer | Sale Price | Title Company |
|---|---|---|---|
| Jaroscak Paul S | -- | Meridian Title | |
| Jaroscak Deborah L | -- | Meridian Title | |
| Jaroscak Paul S | -- | None Available | |
| Jaroscak Paul S | -- | First American Title |
Source: Public Records
Mortgage History
| Date | Status | Borrower | Loan Amount |
|---|---|---|---|
| Open | Jaroscak Deborah L | $205,000 | |
| Closed | Jaroscak Paul S | $28,554 | |
| Closed | Jaroscak Paul S | $228,400 |
Source: Public Records
Tax History Compared to Growth
Tax History
| Year | Tax Paid | Tax Assessment Tax Assessment Total Assessment is a certain percentage of the fair market value that is determined by local assessors to be the total taxable value of land and additions on the property. | Land | Improvement |
|---|---|---|---|---|
| 2025 | $3,656 | $652,000 | $146,200 | $505,800 |
| 2024 | $3,656 | $632,700 | $141,100 | $491,600 |
| 2023 | $3,607 | $588,600 | $123,800 | $464,800 |
| 2022 | $3,767 | $602,900 | $121,400 | $481,500 |
| 2021 | $3,241 | $461,900 | $93,500 | $368,400 |
| 2020 | $3,108 | $413,000 | $93,500 | $319,500 |
| 2019 | $3,074 | $401,600 | $93,500 | $308,100 |
| 2018 | $3,007 | $386,700 | $87,200 | $299,500 |
| 2017 | $2,946 | $369,300 | $87,200 | $282,100 |
| 2016 | $2,798 | $336,500 | $87,200 | $249,300 |
| 2015 | $2,851 | $332,400 | $90,200 | $242,200 |
| 2014 | $2,675 | $305,800 | $84,400 | $221,400 |
Source: Public Records
Map
Nearby Homes
- 5031 Greenstreak Dr
- 13597 S Firetip Ct
- 5087 W London Bay Dr
- 13492 Leaf Wing Ln
- 5217 Autumn Creek Dr
- 13497 S Mimosa Cir
- 13908 S 5180 W
- 13863 S Kessler Peak Dr
- 13377 S Vitasol Ln
- 5141 W Arley Ct
- 13397 S Alto Vista Ln
- 5149 W Arley Ct
- 13392 S Alto Vista Ln
- 13349 S Celestina Ln
- 5288 W Solafax Ln Unit 34-I
- 4722 W Cillian Ln Unit 2411
- 4714 W Cillian Ln Unit 2410
- 5251 W Linley Ct
- 13688 S Hanley Ln Unit JJ204
- 13687 S Hanley Ln Unit DD102
- 5099 W Buckeye View Way
- 5114 W Cloudywing Way
- 5114 Cloudywing Way
- 5092 W Buckeye View Way
- 5086 W Buckeye View Way
- 13597 S Bluewing Way
- 13597 Bluewing Way
- 5124 W Cloudywing Way
- 5124 Cloudywing Way
- 13603 Bluewing Way
- 5098 W Buckeye View Way
- 13603 S Bluewing Way
- 5113 W Buckeye View Way
- 13591 Bluewing Way
- 13609 Bluewing Way
- 13609 S Bluewing Way
- 5108 W Buckeye View Way
- 5073 Crimson Patch Way
- 13587 Bluewing Way
- 13587 S Bluewing Way