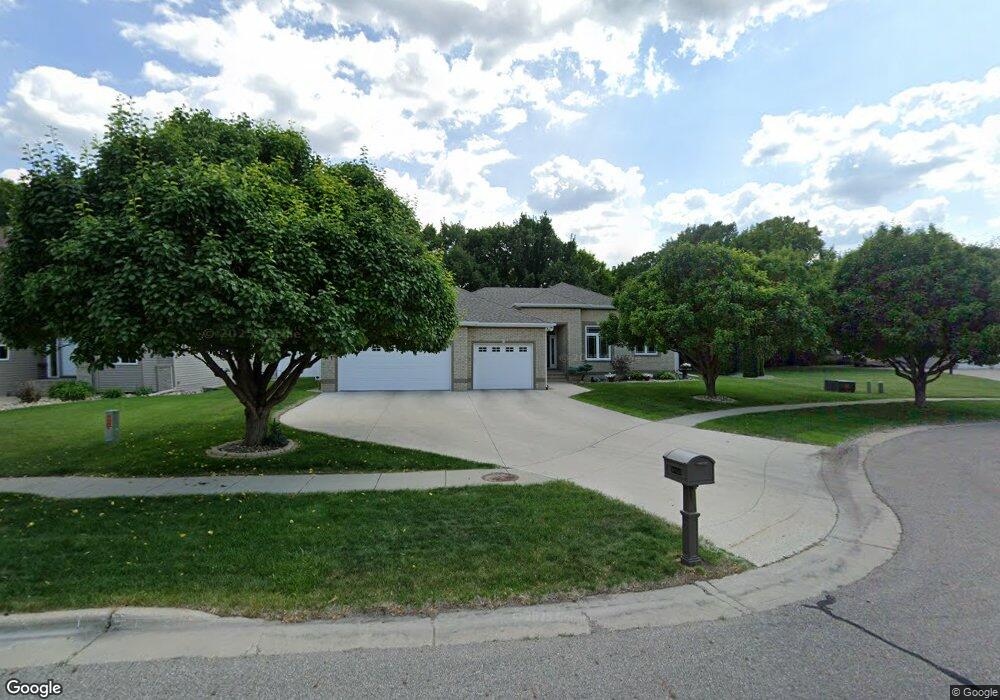
509 20 1/2 Ave E West Fargo, ND 58078
Charleswood NeighborhoodEstimated Value: $495,000 - $624,000
3
Beds
3
Baths
2,097
Sq Ft
$279/Sq Ft
Est. Value
About This Home
This home is located at 509 20 1/2 Ave E, West Fargo, ND 58078 and is currently estimated at $584,142, approximately $278 per square foot. 509 20 1/2 Ave E is a home located in Cass County with nearby schools including South Elementary School, Cheney Middle School, and West Fargo High School.
Ownership History
Date
Name
Owned For
Owner Type
Purchase Details
Closed on
Apr 12, 2024
Sold by
Richmond Beverly A and Richmond Jerald W
Bought by
Sheppard Matthew John and Sheppard Robin Danielle
Current Estimated Value
Home Financials for this Owner
Home Financials are based on the most recent Mortgage that was taken out on this home.
Original Mortgage
$490,500
Outstanding Balance
$483,254
Interest Rate
6.94%
Mortgage Type
New Conventional
Estimated Equity
$100,888
Purchase Details
Closed on
Oct 15, 2021
Sold by
Clark Chad A and Clark Lisa M
Bought by
Richmond Beverly A and Richmond Jerald W
Home Financials for this Owner
Home Financials are based on the most recent Mortgage that was taken out on this home.
Original Mortgage
$260,000
Interest Rate
2.8%
Mortgage Type
New Conventional
Purchase Details
Closed on
Sep 5, 2014
Sold by
Weippert Jerry L and Weippert Rita B
Bought by
Clark Chad A and Clark Lisa M
Home Financials for this Owner
Home Financials are based on the most recent Mortgage that was taken out on this home.
Original Mortgage
$260,000
Interest Rate
4.1%
Mortgage Type
New Conventional
Create a Home Valuation Report for This Property
The Home Valuation Report is an in-depth analysis detailing your home's value as well as a comparison with similar homes in the area
Home Values in the Area
Average Home Value in this Area
Purchase History
| Date | Buyer | Sale Price | Title Company |
|---|---|---|---|
| Sheppard Matthew John | $545,000 | Title Company-Residential | |
| Richmond Beverly A | $510,000 | The Title Co Residential | |
| Clark Chad A | -- | None Available |
Source: Public Records
Mortgage History
| Date | Status | Borrower | Loan Amount |
|---|---|---|---|
| Open | Sheppard Matthew John | $490,500 | |
| Previous Owner | Richmond Beverly A | $260,000 | |
| Previous Owner | Clark Chad A | $260,000 |
Source: Public Records
Tax History Compared to Growth
Tax History
| Year | Tax Paid | Tax Assessment Tax Assessment Total Assessment is a certain percentage of the fair market value that is determined by local assessors to be the total taxable value of land and additions on the property. | Land | Improvement |
|---|---|---|---|---|
| 2024 | $6,903 | $278,150 | $39,000 | $239,150 |
| 2023 | $6,909 | $258,300 | $39,000 | $219,300 |
| 2022 | $6,980 | $250,100 | $39,000 | $211,100 |
| 2021 | $6,284 | $217,050 | $34,900 | $182,150 |
| 2020 | $6,064 | $208,800 | $34,900 | $173,900 |
| 2019 | $5,791 | $205,750 | $34,900 | $170,850 |
| 2018 | $5,638 | $204,050 | $34,900 | $169,150 |
| 2017 | $5,513 | $204,050 | $34,900 | $169,150 |
| 2016 | $4,979 | $202,050 | $34,900 | $167,150 |
| 2015 | $4,453 | $166,050 | $24,200 | $141,850 |
| 2014 | $3,568 | $155,200 | $24,200 | $131,000 |
| 2013 | $3,121 | $148,950 | $24,200 | $124,750 |
Source: Public Records
Map
Nearby Homes
- 509 20 1 2 Ave E
- 517 20 1 2 Ave E
- 517 20 1/2 Ave E
- 525 20 1/2 Ave E
- 2058 5th St E
- 2050 5th St E
- 2049 5th St E
- 533 20 1/2 Ave E
- 2042 5th St E
- 2041 5 St E
- 2048 Ruxton Ct
- 2041 5th St E
- 607 20 1/2 Ave E
- 607 20 1 2 Ave E
- 2034 5th St E
- 2040 Ruxton Ct
- 2033 5th St E
- 615 20 1 2 Ave E
- 615 20 1/2 Ave E
- 2032 Ruxton Ct