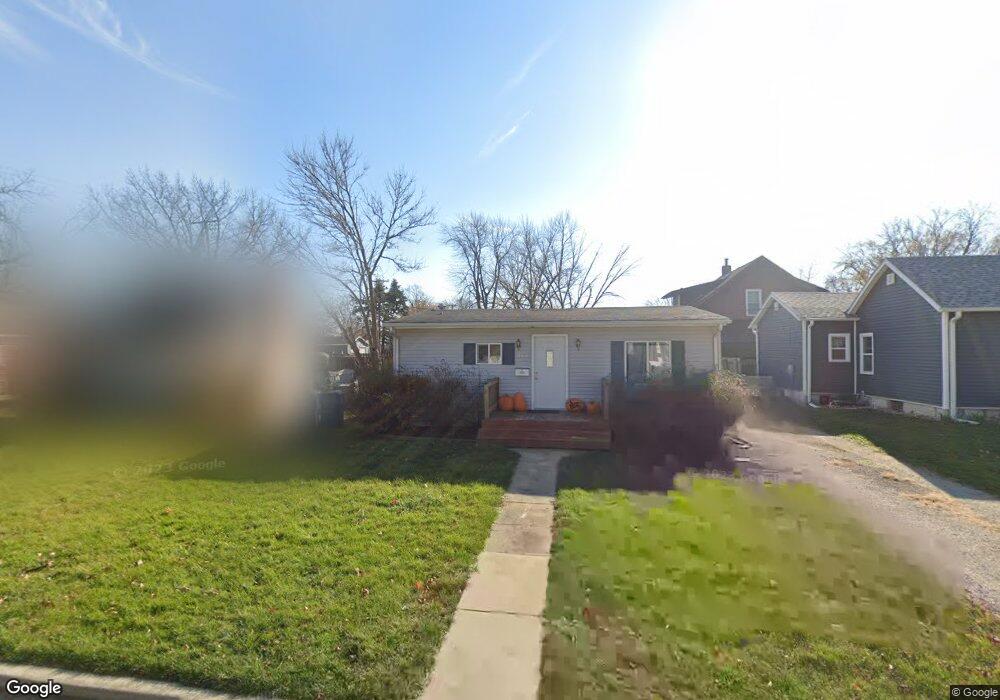
509 3rd St Mendota, IL 61342
Estimated Value: $68,000 - $85,731
2
Beds
1
Bath
720
Sq Ft
$107/Sq Ft
Est. Value
About This Home
This home is located at 509 3rd St, Mendota, IL 61342 and is currently estimated at $76,933, approximately $106 per square foot. 509 3rd St is a home located in LaSalle County with nearby schools including Northbrook School, Lincoln Elementary School, and Blackstone Elementary School.
Ownership History
Date
Name
Owned For
Owner Type
Purchase Details
Closed on
Sep 26, 2019
Sold by
Dion Wendy and Jeffrey A Faraher Estate
Bought by
Barrett Jeffrey
Current Estimated Value
Purchase Details
Closed on
Sep 23, 2011
Sold by
Centrue Bank
Bought by
Faraher Jeffrey A
Purchase Details
Closed on
Dec 13, 2007
Sold by
Weygand William X and Weygand Deborah J
Bought by
Weygand Michael
Home Financials for this Owner
Home Financials are based on the most recent Mortgage that was taken out on this home.
Original Mortgage
$63,000
Interest Rate
8.45%
Mortgage Type
Purchase Money Mortgage
Create a Home Valuation Report for This Property
The Home Valuation Report is an in-depth analysis detailing your home's value as well as a comparison with similar homes in the area
Home Values in the Area
Average Home Value in this Area
Purchase History
| Date | Buyer | Sale Price | Title Company |
|---|---|---|---|
| Barrett Jeffrey | $38,000 | None Available | |
| Faraher Jeffrey A | $41,000 | None Available | |
| Weygand Michael | $55,000 | None Available |
Source: Public Records
Mortgage History
| Date | Status | Borrower | Loan Amount |
|---|---|---|---|
| Previous Owner | Weygand Michael | $63,000 |
Source: Public Records
Tax History Compared to Growth
Tax History
| Year | Tax Paid | Tax Assessment Tax Assessment Total Assessment is a certain percentage of the fair market value that is determined by local assessors to be the total taxable value of land and additions on the property. | Land | Improvement |
|---|---|---|---|---|
| 2024 | $1,917 | $22,126 | $2,266 | $19,860 |
| 2023 | $1,836 | $20,605 | $2,110 | $18,495 |
| 2022 | $1,699 | $18,785 | $1,924 | $16,861 |
| 2021 | $1,691 | $17,782 | $1,821 | $15,961 |
| 2020 | $1,591 | $16,789 | $1,719 | $15,070 |
| 2019 | $1,037 | $16,789 | $1,719 | $15,070 |
| 2018 | $1,035 | $16,421 | $1,681 | $14,740 |
| 2017 | $1,033 | $16,214 | $1,660 | $14,554 |
| 2016 | $972 | $15,523 | $1,589 | $13,934 |
| 2015 | $929 | $15,052 | $1,541 | $13,511 |
| 2012 | -- | $17,240 | $1,765 | $15,475 |
Source: Public Records
Map
Nearby Homes