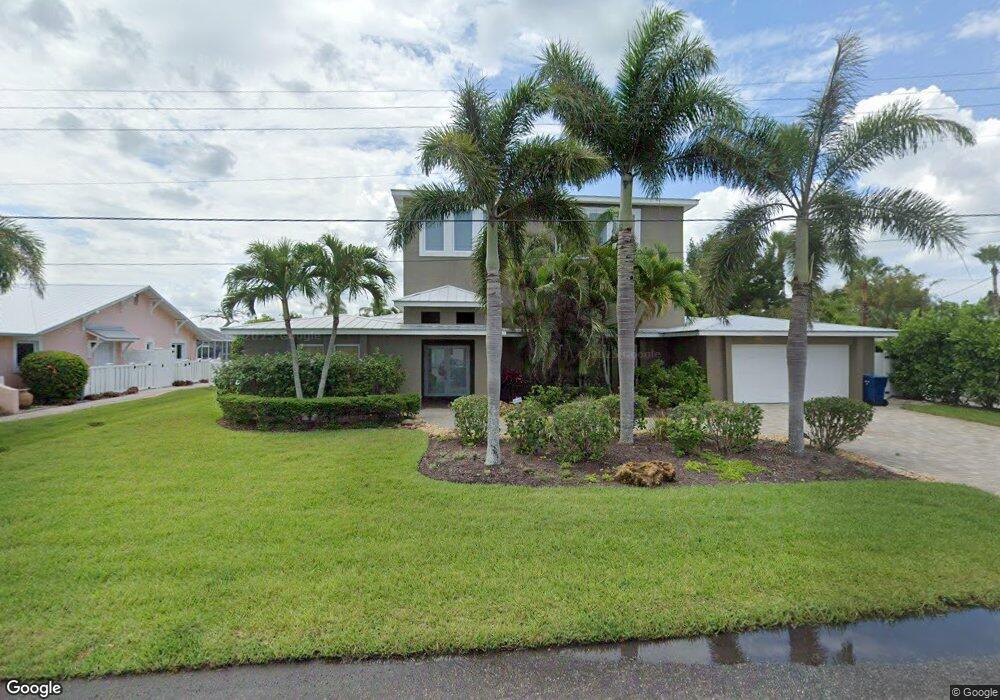
509 72nd St Holmes Beach, FL 34217
Estimated Value: $1,542,000 - $3,153,923
6
Beds
5
Baths
3,960
Sq Ft
$640/Sq Ft
Est. Value
About This Home
This home is located at 509 72nd St, Holmes Beach, FL 34217 and is currently estimated at $2,532,731, approximately $639 per square foot. 509 72nd St is a home located in Manatee County with nearby schools including Anna Maria Elementary School, Martha B. King Middle School, and Manatee High School.
Ownership History
Date
Name
Owned For
Owner Type
Purchase Details
Closed on
Jan 18, 2008
Sold by
Hieronimus Earl E and Hieronimus Barbara G
Bought by
Hilsabeck Angela G and Hilsabeck Revocable T Angela G
Current Estimated Value
Purchase Details
Closed on
Apr 15, 1999
Sold by
Verbeek Albert and Verbeek Shirley
Bought by
Hieronimus Earl E and Hieronimus Barbara G
Home Financials for this Owner
Home Financials are based on the most recent Mortgage that was taken out on this home.
Original Mortgage
$250,000
Interest Rate
7.08%
Create a Home Valuation Report for This Property
The Home Valuation Report is an in-depth analysis detailing your home's value as well as a comparison with similar homes in the area
Home Values in the Area
Average Home Value in this Area
Purchase History
| Date | Buyer | Sale Price | Title Company |
|---|---|---|---|
| Hilsabeck Angela G | $708,000 | Sunbelt Title Agency | |
| Hieronimus Earl E | $175,000 | -- |
Source: Public Records
Mortgage History
| Date | Status | Borrower | Loan Amount |
|---|---|---|---|
| Previous Owner | Hieronimus Earl E | $250,000 |
Source: Public Records
Tax History Compared to Growth
Tax History
| Year | Tax Paid | Tax Assessment Tax Assessment Total Assessment is a certain percentage of the fair market value that is determined by local assessors to be the total taxable value of land and additions on the property. | Land | Improvement |
|---|---|---|---|---|
| 2025 | $27,881 | $812,354 | $765,000 | $47,354 |
| 2024 | $27,881 | $2,213,523 | $765,000 | $1,448,523 |
| 2023 | $26,878 | $2,146,221 | $680,000 | $1,466,221 |
| 2022 | $23,746 | $1,797,348 | $500,000 | $1,297,348 |
| 2021 | $18,508 | $1,145,398 | $450,000 | $695,398 |
| 2020 | $17,911 | $1,053,503 | $400,000 | $653,503 |
| 2019 | $17,796 | $1,053,503 | $400,000 | $653,503 |
| 2018 | $16,666 | $999,812 | $400,000 | $599,812 |
| 2017 | $14,604 | $920,080 | $0 | $0 |
| 2016 | $11,068 | $655,608 | $0 | $0 |
| 2015 | $10,012 | $672,566 | $0 | $0 |
| 2014 | $10,012 | $587,664 | $0 | $0 |
| 2013 | $9,404 | $547,604 | $340,700 | $206,904 |
Source: Public Records
Map
Nearby Homes