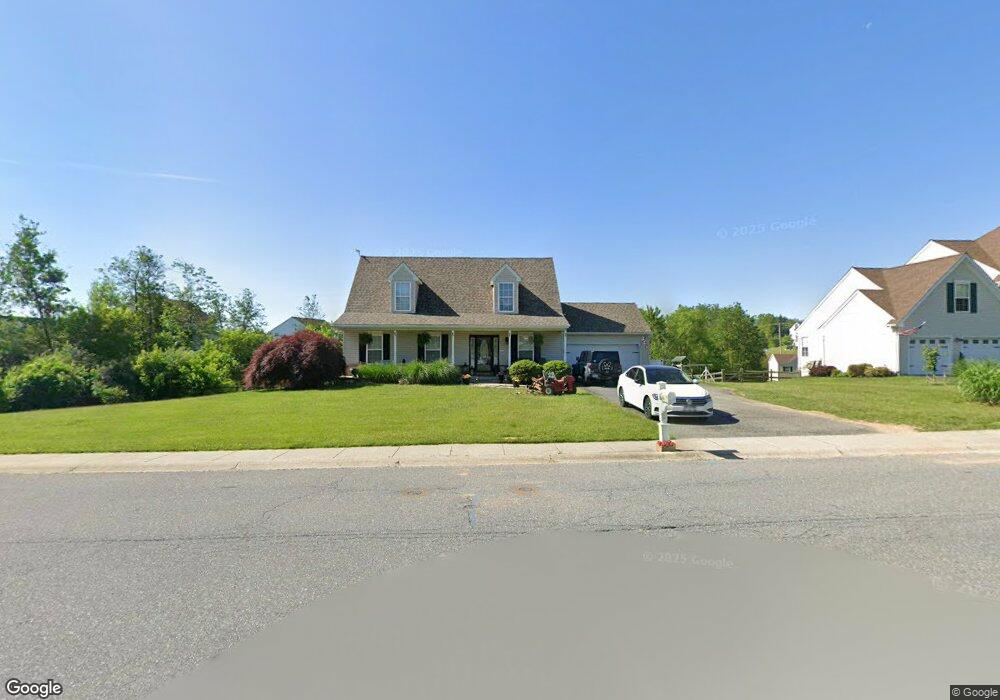
509 Apple Tree Ln Oxford, PA 19363
Estimated Value: $452,745 - $491,000
3
Beds
2
Baths
1,960
Sq Ft
$246/Sq Ft
Est. Value
About This Home
This home is located at 509 Apple Tree Ln, Oxford, PA 19363 and is currently estimated at $481,186, approximately $245 per square foot. 509 Apple Tree Ln is a home located in Chester County with nearby schools including Elk Ridge School, Nottingham School, and Jordan Bank Elementary School.
Ownership History
Date
Name
Owned For
Owner Type
Purchase Details
Closed on
Jul 21, 2020
Sold by
Vanzyi Robert J and Costello Shannon L
Bought by
Vanzyl Robert and Vanzyl Van Zyl
Current Estimated Value
Home Financials for this Owner
Home Financials are based on the most recent Mortgage that was taken out on this home.
Original Mortgage
$255,000
Outstanding Balance
$179,757
Interest Rate
3%
Mortgage Type
New Conventional
Estimated Equity
$301,429
Purchase Details
Closed on
Mar 31, 2006
Sold by
Vanzyl Robert J
Bought by
Vanzyl Robert J and Costello Shannon L
Home Financials for this Owner
Home Financials are based on the most recent Mortgage that was taken out on this home.
Original Mortgage
$240,800
Interest Rate
6.34%
Mortgage Type
New Conventional
Purchase Details
Closed on
Jun 30, 1999
Sold by
Jmcw Inc
Bought by
Vanzyl Robert J
Home Financials for this Owner
Home Financials are based on the most recent Mortgage that was taken out on this home.
Original Mortgage
$140,956
Interest Rate
7.19%
Create a Home Valuation Report for This Property
The Home Valuation Report is an in-depth analysis detailing your home's value as well as a comparison with similar homes in the area
Home Values in the Area
Average Home Value in this Area
Purchase History
| Date | Buyer | Sale Price | Title Company |
|---|---|---|---|
| Vanzyl Robert | -- | Entrust Services Group Llc | |
| Vanzyl Robert J | -- | Transcontinental Title Co | |
| Vanzyl Robert J | $154,099 | -- |
Source: Public Records
Mortgage History
| Date | Status | Borrower | Loan Amount |
|---|---|---|---|
| Open | Vanzyl Robert | $255,000 | |
| Closed | Vanzyl Robert J | $240,800 | |
| Closed | Vanzyl Robert J | $140,956 |
Source: Public Records
Tax History Compared to Growth
Tax History
| Year | Tax Paid | Tax Assessment Tax Assessment Total Assessment is a certain percentage of the fair market value that is determined by local assessors to be the total taxable value of land and additions on the property. | Land | Improvement |
|---|---|---|---|---|
| 2025 | $6,128 | $150,900 | $33,240 | $117,660 |
| 2024 | $6,128 | $150,900 | $33,240 | $117,660 |
| 2023 | $5,914 | $150,900 | $33,240 | $117,660 |
| 2022 | $5,707 | $150,900 | $33,240 | $117,660 |
| 2021 | $5,517 | $150,900 | $33,240 | $117,660 |
| 2020 | $5,497 | $153,420 | $33,240 | $120,180 |
| 2019 | $5,449 | $153,420 | $33,240 | $120,180 |
| 2018 | $5,449 | $153,420 | $33,240 | $120,180 |
| 2017 | $5,402 | $153,420 | $33,240 | $120,180 |
| 2016 | $4,453 | $141,010 | $33,240 | $107,770 |
| 2015 | $4,453 | $141,010 | $33,240 | $107,770 |
| 2014 | $4,453 | $141,010 | $33,240 | $107,770 |
Source: Public Records
Map
Nearby Homes
- Kipling Plan at Langston
- Savannah Plan at Langston
- Parker Plan at Langston
- Sebastian Plan at Langston
- Harrison Plan at Langston
- Ethan Plan at Langston
- Hawthorne Plan at Langston
- Andrews Plan at Langston
- Woodford Plan at Langston
- Magnolia Plan at Langston
- Lachlan Plan at Langston
- Devonshire Plan at Langston
- Augusta Plan at Langston
- Covington Plan at Langston
- Nottingham Plan at Langston
- Caldwell Plan at Langston
- Arcadia Plan at Langston
- 100 Hearthside Way Unit DEVONSHIRE
- 100 Hearthside Way Unit ANDREWS
- 100 Hearthside Way Unit COVINGTON
- 507 Apple Tree Ln
- 834 Slate Hill Dr
- 830 Slate Hill Dr
- 147 Wickersham Rd
- 603 Quill Ct
- 604 Quill Ct
- 512 Apple Tree Ln
- 826 Slate Hill Dr
- 500 Apple Tree Ln
- 608 Quill Ct
- 607 Quill Ct
- 700 Slate Hill Dr
- 822 Slate Hill Dr
- 133 Wickersham Rd
- 829 Slate Hill Dr
- 833 Slate Hill Dr
- 0 Wickersham Rd Unit 7059156
- LT 4-9 Wickersham Rd
- 825 Slate Hill Dr
- 612 Quill Ct