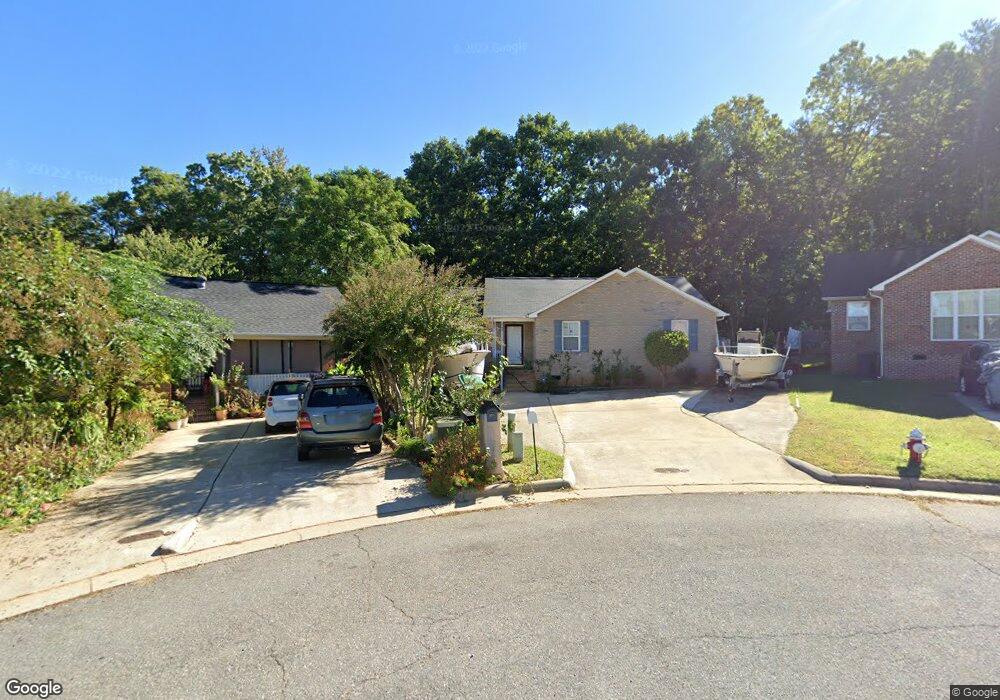
509 Bacon Ct High Point, NC 27263
Greater High Point NeighborhoodEstimated Value: $170,000 - $222,000
3
Beds
2
Baths
1,135
Sq Ft
$167/Sq Ft
Est. Value
About This Home
This home is located at 509 Bacon Ct, High Point, NC 27263 and is currently estimated at $189,904, approximately $167 per square foot. 509 Bacon Ct is a home located in Guilford County with nearby schools including Allen Jay Elementary School, Southern Guilford Middle, and Southern Guilford High School.
Ownership History
Date
Name
Owned For
Owner Type
Purchase Details
Closed on
Dec 13, 2002
Sold by
Pham Ha Thi
Bought by
Pham Ha Thi and Vanle Sunny
Current Estimated Value
Home Financials for this Owner
Home Financials are based on the most recent Mortgage that was taken out on this home.
Original Mortgage
$62,625
Interest Rate
6.07%
Purchase Details
Closed on
Sep 8, 2000
Sold by
Housing Authority City Of H P
Bought by
Pham Ha Thi
Home Financials for this Owner
Home Financials are based on the most recent Mortgage that was taken out on this home.
Original Mortgage
$59,867
Interest Rate
8.11%
Create a Home Valuation Report for This Property
The Home Valuation Report is an in-depth analysis detailing your home's value as well as a comparison with similar homes in the area
Home Values in the Area
Average Home Value in this Area
Purchase History
| Date | Buyer | Sale Price | Title Company |
|---|---|---|---|
| Pham Ha Thi | -- | -- | |
| Pham Ha Thi | -- | -- |
Source: Public Records
Mortgage History
| Date | Status | Borrower | Loan Amount |
|---|---|---|---|
| Closed | Pham Ha Thi | $62,625 | |
| Closed | Pham Ha Thi | $59,867 | |
| Closed | Pham Ha Thi | $20,500 |
Source: Public Records
Tax History Compared to Growth
Tax History
| Year | Tax Paid | Tax Assessment Tax Assessment Total Assessment is a certain percentage of the fair market value that is determined by local assessors to be the total taxable value of land and additions on the property. | Land | Improvement |
|---|---|---|---|---|
| 2025 | $1,568 | $113,800 | $20,000 | $93,800 |
| 2024 | $1,568 | $113,800 | $20,000 | $93,800 |
| 2023 | $1,568 | $113,800 | $20,000 | $93,800 |
| 2022 | $1,534 | $113,800 | $20,000 | $93,800 |
| 2021 | $1,109 | $80,500 | $15,000 | $65,500 |
| 2020 | $1,109 | $80,500 | $15,000 | $65,500 |
| 2019 | $1,109 | $80,500 | $0 | $0 |
| 2018 | $1,104 | $80,500 | $0 | $0 |
| 2017 | $1,109 | $80,500 | $0 | $0 |
| 2016 | $1,251 | $89,200 | $0 | $0 |
| 2015 | $1,258 | $89,200 | $0 | $0 |
| 2014 | $1,279 | $89,200 | $0 | $0 |
Source: Public Records
Map
Nearby Homes
- 600 E Fairfield Rd
- 926 Norton St
- 921 Norton St
- 2719 Granville St
- 706 E Fairfield Rd
- 825 Hopewell St
- 607 Martha Place
- 914 Nance Ave
- 400 E Springfield Rd
- 2708 Ernest St
- 304 E Springfield Rd
- 312 Model Farm Rd
- 1103 Pegram Ave
- 2716 Allen Jay Rd
- 112 Havenwood Dr
- 327 Wynnewood Dr
- 300 W Springfield Rd
- 2616 Ingram Rd
- 1020 Westbrook Ct
- 102 Quakerwood Dr