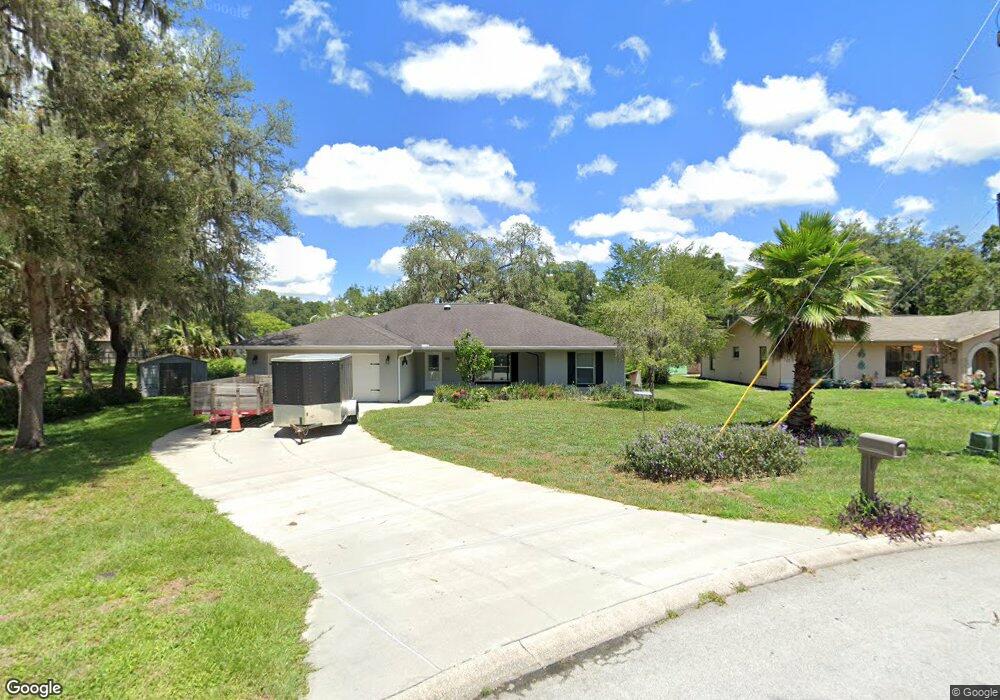
509 Baylor Terrace Inverness, FL 34450
Estimated Value: $293,568 - $337,000
3
Beds
2
Baths
1,740
Sq Ft
$180/Sq Ft
Est. Value
About This Home
This home is located at 509 Baylor Terrace, Inverness, FL 34450 and is currently estimated at $313,142, approximately $179 per square foot. 509 Baylor Terrace is a home located in Citrus County with nearby schools including Inverness Primary School, Inverness Middle School, and Citrus High School.
Ownership History
Date
Name
Owned For
Owner Type
Purchase Details
Closed on
Dec 1, 2008
Sold by
Bryan Jared J and Bryan Ashley B
Bought by
Gustafson Trudy and Gasper Larry
Current Estimated Value
Home Financials for this Owner
Home Financials are based on the most recent Mortgage that was taken out on this home.
Original Mortgage
$148,000
Outstanding Balance
$99,588
Interest Rate
6.51%
Mortgage Type
Purchase Money Mortgage
Estimated Equity
$213,554
Purchase Details
Closed on
Jun 13, 2007
Sold by
Latitude 28 Construction Inc
Bought by
Bryan Jared J and Bryan Ashley B
Home Financials for this Owner
Home Financials are based on the most recent Mortgage that was taken out on this home.
Original Mortgage
$148,720
Interest Rate
6.12%
Mortgage Type
Purchase Money Mortgage
Purchase Details
Closed on
Feb 16, 2006
Sold by
Rider Stephanie and Peck Shannon
Bought by
Latitude 28 Construction Inc
Purchase Details
Closed on
Jun 24, 2002
Sold by
Granowitz Edward
Bought by
Peck Ralph J and R & J Trust
Create a Home Valuation Report for This Property
The Home Valuation Report is an in-depth analysis detailing your home's value as well as a comparison with similar homes in the area
Home Values in the Area
Average Home Value in this Area
Purchase History
| Date | Buyer | Sale Price | Title Company |
|---|---|---|---|
| Gustafson Trudy | $185,000 | American Title Services Of C | |
| Bryan Jared J | $185,900 | First American Title Ins Co | |
| Latitude 28 Construction Inc | $26,500 | None Available | |
| Peck Ralph J | $5,500 | First American Title Ins Co |
Source: Public Records
Mortgage History
| Date | Status | Borrower | Loan Amount |
|---|---|---|---|
| Open | Gustafson Trudy | $148,000 | |
| Previous Owner | Bryan Jared J | $148,720 |
Source: Public Records
Tax History Compared to Growth
Tax History
| Year | Tax Paid | Tax Assessment Tax Assessment Total Assessment is a certain percentage of the fair market value that is determined by local assessors to be the total taxable value of land and additions on the property. | Land | Improvement |
|---|---|---|---|---|
| 2024 | $3,548 | $284,968 | $11,490 | $273,478 |
| 2023 | $3,548 | $281,882 | $11,490 | $270,392 |
| 2022 | $2,822 | $196,771 | $6,200 | $190,571 |
| 2021 | $2,473 | $163,920 | $6,200 | $157,720 |
| 2020 | $2,219 | $145,531 | $5,900 | $139,631 |
| 2019 | $2,075 | $133,682 | $5,900 | $127,782 |
| 2018 | $2,062 | $136,761 | $5,900 | $130,861 |
| 2017 | $1,868 | $116,022 | $5,900 | $110,122 |
| 2016 | $1,817 | $109,350 | $5,900 | $103,450 |
| 2015 | $1,684 | $97,840 | $6,590 | $91,250 |
| 2014 | $1,725 | $96,950 | $6,677 | $90,273 |
Source: Public Records
Map
Nearby Homes
- 714 Kingsley Terrace
- 725 Kingsley Terrace
- 732 Wharton Terrace
- 1505 Lakeview Dr
- 729 Longfellow Terrace
- 1406 Eden Dr
- 1220 Mossy Oak Dr
- 1423 Longboat Point
- 1221 Emerson St
- 1336 Cypress Cove Ct
- 1104 Lake Shore Dr
- 475 Landing Blvd
- 1288 Cypress Cove Ct
- 1302 Cypress Cove Ct
- 1940 S Mooring Dr
- 1212 Cypress Cove Ct
- 1980 S Tsala Terrace
- 1885 S Westlake Dr
- 1316 Eden Dr
- 1880 S Westlake Dr
- 559 Baylor Terrace
- 507 Baylor Terrace
- 2408 S Shelly Ave
- 2412 S Shelly Ave
- 607 Baylor Terrace
- 2404 S Shelly Ave
- 611 Baylor Terrace
- 606 Baylor Terrace
- 2400 S Shelly Ave
- 503 Baylor Terrace
- 2480 S Shelly Ave
- 2409 S Shelly Ave
- 612 Baylor Terrace
- 2413 S Shelly Ave
- 7606 E Broyhill Place
- 2403 S Shelly Ave
- 7602 E Broyhill Place
- 2417 S Shelly Ave
- 620 Baylor Terrace
- 2317 S Shelly Ave