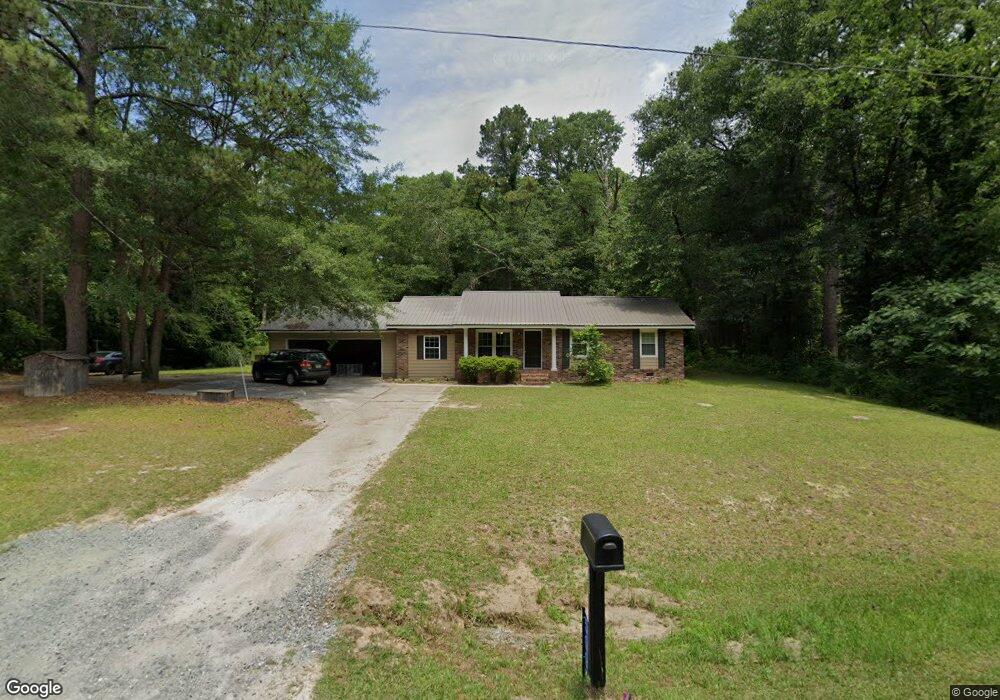
509 Blackshear Ferry Rd W Dublin, GA 31021
Estimated Value: $151,000 - $240,000
3
Beds
2
Baths
1,456
Sq Ft
$134/Sq Ft
Est. Value
About This Home
This home is located at 509 Blackshear Ferry Rd W, Dublin, GA 31021 and is currently estimated at $194,854, approximately $133 per square foot. 509 Blackshear Ferry Rd W is a home located in Laurens County with nearby schools including Northwest Laurens Elementary School, Southwest Laurens Elementary School, and East Laurens Primary School.
Ownership History
Date
Name
Owned For
Owner Type
Purchase Details
Closed on
Jul 7, 2025
Sold by
Thompson Katherine S
Bought by
Gay William A
Current Estimated Value
Home Financials for this Owner
Home Financials are based on the most recent Mortgage that was taken out on this home.
Original Mortgage
$71,474
Outstanding Balance
$69,464
Interest Rate
6.85%
Mortgage Type
New Conventional
Estimated Equity
$125,390
Purchase Details
Closed on
Apr 6, 2020
Sold by
Thompson Katherine S
Bought by
Thompson Katherine S and Gay William A
Purchase Details
Closed on
Sep 26, 2019
Sold by
Emerald City Enterprises Llc
Bought by
Thompson Katherine S
Home Financials for this Owner
Home Financials are based on the most recent Mortgage that was taken out on this home.
Original Mortgage
$113,550
Interest Rate
3.5%
Mortgage Type
New Conventional
Purchase Details
Closed on
Mar 1, 2019
Sold by
Williams Stephen Allen
Bought by
Emerald City Enterprises Llc
Purchase Details
Closed on
Dec 31, 1995
Sold by
Mullis James E and Mullis Kim
Bought by
Williams Stephen All
Purchase Details
Closed on
Feb 26, 1993
Sold by
Tapley Michael and Tapley Kat
Create a Home Valuation Report for This Property
The Home Valuation Report is an in-depth analysis detailing your home's value as well as a comparison with similar homes in the area
Home Values in the Area
Average Home Value in this Area
Purchase History
| Date | Buyer | Sale Price | Title Company |
|---|---|---|---|
| Gay William A | -- | -- | |
| Thompson Katherine S | -- | -- | |
| Thompson Katherine S | $111,000 | -- | |
| Emerald City Enterprises Llc | $48,000 | -- | |
| Williams Stephen All | $56,000 | -- | |
| -- | $25,000 | -- |
Source: Public Records
Mortgage History
| Date | Status | Borrower | Loan Amount |
|---|---|---|---|
| Open | Gay William A | $71,474 | |
| Previous Owner | Thompson Katherine S | $113,550 |
Source: Public Records
Tax History Compared to Growth
Tax History
| Year | Tax Paid | Tax Assessment Tax Assessment Total Assessment is a certain percentage of the fair market value that is determined by local assessors to be the total taxable value of land and additions on the property. | Land | Improvement |
|---|---|---|---|---|
| 2024 | $838 | $39,807 | $2,044 | $37,763 |
| 2023 | $775 | $36,467 | $2,044 | $34,423 |
| 2022 | $823 | $36,407 | $1,984 | $34,423 |
| 2021 | $841 | $36,265 | $2,182 | $34,083 |
| 2020 | $842 | $36,265 | $2,182 | $34,083 |
| 2019 | $618 | $25,983 | $2,182 | $23,801 |
| 2018 | $618 | $25,983 | $2,182 | $23,801 |
| 2017 | $574 | $25,983 | $2,182 | $23,801 |
| 2016 | $575 | $25,983 | $2,182 | $23,801 |
| 2015 | $575 | $25,982 | $2,182 | $23,801 |
| 2014 | $636 | $28,143 | $2,130 | $26,013 |
Source: Public Records
Map
Nearby Homes
- 550 Masters Cir
- 912 Sussex Ct
- 157 Lakeview Ln
- 415 Willa Ln
- 256 Wells Cir
- 719 Jones Ln
- 446 Willow Point Dr
- 522 Clearwater Cir
- 1400 Peach St
- 209 Plum St
- 603 Old Toomsboro Rd
- 108 Plum St
- 214 Holly Dr
- 105 Palisade Dr
- 0 Flanders Ct N Unit 30069
- 0 Flanders Ct N Unit 10554837
- 0 Flanders Ct N Unit 29123
- 305 Lassiter Dr
- 311 Holly Dr
- 209 Rollingwood Dr
- 517 Blackshear Ferry Rd W
- 807 W Bobby Jones Dr
- 815 Bobby Jones Dr
- 317 Bp Clark Ln
- 523 Blackshear Ferry Rd W
- 827 Bobby Jones Dr
- 528 Blackshear Ferry Rd W
- 808 Bobby Jones Dr
- 535 Blackshear Ferry Rd W
- 833 Bobby Jones Dr Unit 17 & 18
- 833 Bobby Jones Dr
- 822 Bobby Jones Dr
- 828 Bobby Jones Dr
- 505 Masters Cir
- 505 Masters Cir Unit 12
- 867 Bobby Jones Dr
- 511 Masters Cir
- 517 Masters Cir
- 873 Bobby Jones Dr
- 542 Blackshear Ferry Rd W