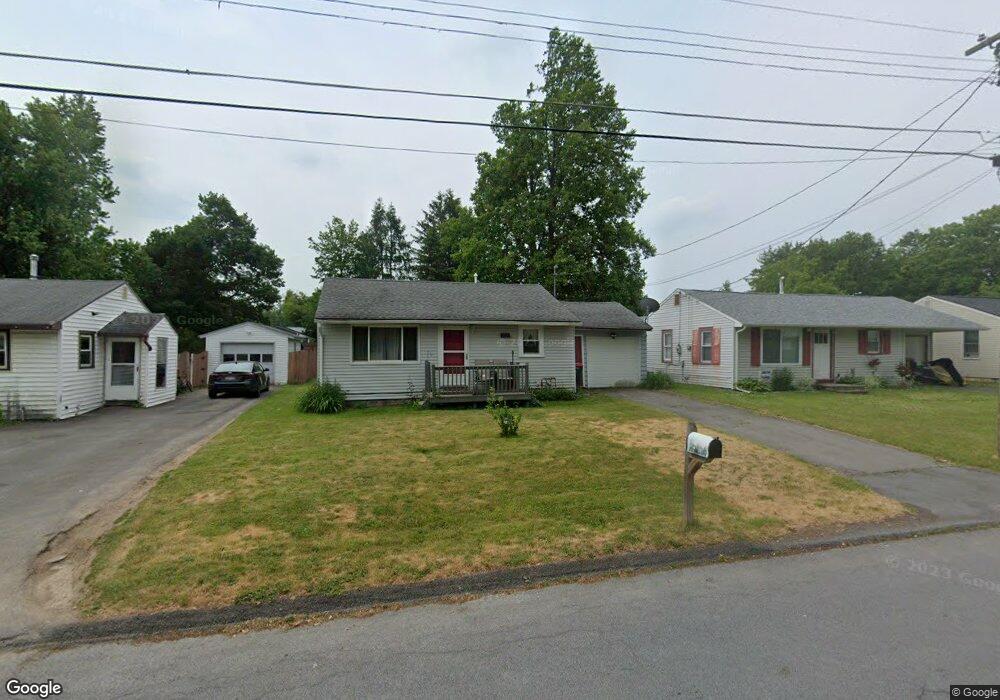
509 Charles St Chittenango, NY 13037
Estimated Value: $119,000 - $152,849
2
Beds
1
Bath
672
Sq Ft
$203/Sq Ft
Est. Value
About This Home
This home is located at 509 Charles St, Chittenango, NY 13037 and is currently estimated at $136,712, approximately $203 per square foot. 509 Charles St is a home located in Madison County with nearby schools including Chittenango High School.
Ownership History
Date
Name
Owned For
Owner Type
Purchase Details
Closed on
Aug 16, 2024
Sold by
Parmalee Diane R
Bought by
Jackson Jennifer R
Current Estimated Value
Purchase Details
Closed on
Apr 18, 2012
Sold by
Brunet-Releyea Melanie J
Bought by
Parmalee Diane
Home Financials for this Owner
Home Financials are based on the most recent Mortgage that was taken out on this home.
Original Mortgage
$60,867
Interest Rate
3.89%
Mortgage Type
Purchase Money Mortgage
Purchase Details
Closed on
Dec 23, 2009
Sold by
Vecchio Janet
Bought by
Brunet-Relyea Melanie
Home Financials for this Owner
Home Financials are based on the most recent Mortgage that was taken out on this home.
Original Mortgage
$48,995
Interest Rate
5.5%
Mortgage Type
FHA
Purchase Details
Closed on
Mar 15, 2004
Sold by
Rosko John M
Bought by
Vecchio Janet
Purchase Details
Closed on
Apr 28, 1995
Sold by
Stedman Esther G
Bought by
Rosko John M
Create a Home Valuation Report for This Property
The Home Valuation Report is an in-depth analysis detailing your home's value as well as a comparison with similar homes in the area
Home Values in the Area
Average Home Value in this Area
Purchase History
| Date | Buyer | Sale Price | Title Company |
|---|---|---|---|
| Jackson Jennifer R | -- | None Listed On Document | |
| Parmalee Diane | $54,500 | -- | |
| Brunet-Relyea Melanie | $49,900 | -- | |
| Vecchio Janet | $44,900 | John Hall | |
| Rosko John M | $44,000 | -- |
Source: Public Records
Mortgage History
| Date | Status | Borrower | Loan Amount |
|---|---|---|---|
| Previous Owner | Parmalee Diane | $60,867 | |
| Previous Owner | Brunet-Relyea Melanie | $48,995 |
Source: Public Records
Tax History
| Year | Tax Paid | Tax Assessment Tax Assessment Total Assessment is a certain percentage of the fair market value that is determined by local assessors to be the total taxable value of land and additions on the property. | Land | Improvement |
|---|---|---|---|---|
| 2024 | $3,138 | $66,400 | $15,100 | $51,300 |
| 2023 | $3,152 | $66,400 | $15,100 | $51,300 |
| 2022 | $3,046 | $66,400 | $15,100 | $51,300 |
| 2021 | $3,029 | $66,400 | $15,100 | $51,300 |
| 2020 | $1,544 | $66,400 | $15,100 | $51,300 |
| 2019 | $1,468 | $66,400 | $15,100 | $51,300 |
| 2018 | $1,468 | $66,400 | $15,100 | $51,300 |
| 2017 | $1,499 | $66,400 | $15,100 | $51,300 |
| 2016 | $1,519 | $66,400 | $15,100 | $51,300 |
| 2015 | -- | $66,400 | $15,100 | $51,300 |
| 2014 | -- | $66,400 | $15,100 | $51,300 |
Source: Public Records
Map
Nearby Homes
- 620 Cain St
- 000 Warren St
- 117 Hawthorne Way
- 524 Tuscarora Rd
- 146 Hawthorne Way
- 114 Laura Ct
- 1011 Gill St
- 2233 Gidran Dr
- 0 Walnut Point Rd Unit S1594837
- 0 Walnut Point Rd Unit S1594838
- 628 Lakeport Rd
- 200 Mohawk St
- 9010 Kennedy Ln Ln
- 7053 Lakeport Rd
- 6749 Ramsgate Rd
- 2249 Gidran Dr
- 2237 Gidran Dr
- 2229 Gidran Dr
- 1960 N Ridge Dr
- 1954 N Ridge Dr
Your Personal Tour Guide
Ask me questions while you tour the home.