509 Compton Rd Cincinnati, OH 45215
Estimated Value: $293,000 - $479,000
3
Beds
2
Baths
1,659
Sq Ft
$237/Sq Ft
Est. Value
About This Home
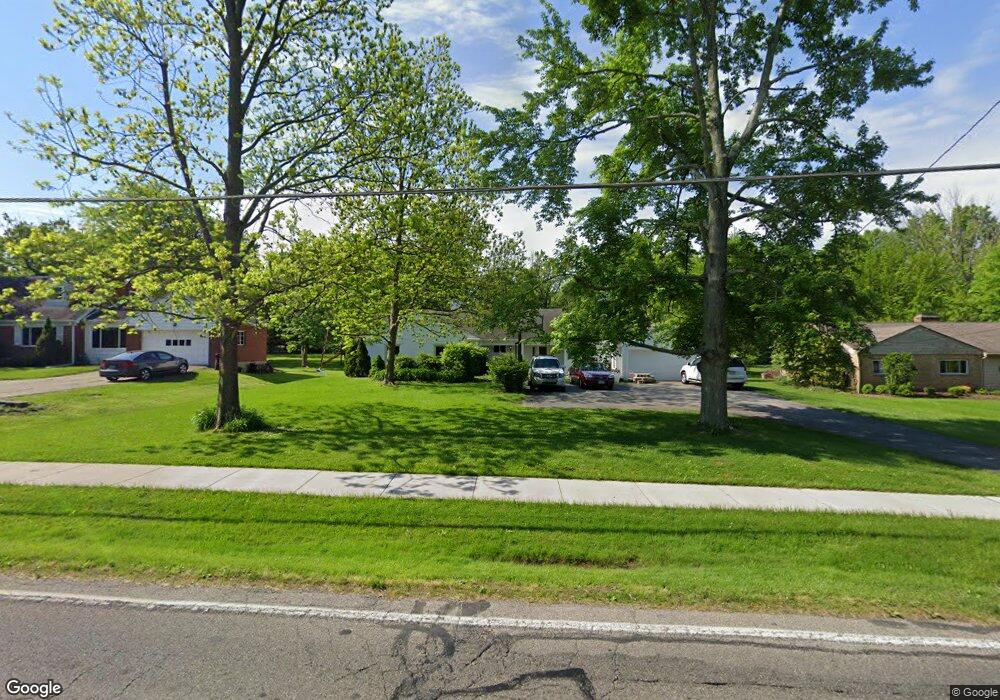
This home is located at 509 Compton Rd, Cincinnati, OH 45215 and is currently estimated at $392,756, approximately $236 per square foot. 509 Compton Rd is a home located in Hamilton County with nearby schools including Wyoming High School and John Paul II Catholic School.
Ownership History
Date
Name
Owned For
Owner Type
Purchase Details
Closed on
Jul 29, 2011
Sold by
Deutsche Bank National Trust Company
Bought by
Sirk Larry W
Current Estimated Value
Purchase Details
Closed on
Jan 7, 2011
Sold by
Mitchell Sharon Lynn Merten
Bought by
Deutsche Bank National Trust Company
Purchase Details
Closed on
Oct 5, 1996
Sold by
Merten H Russell and Merten Violet Alice
Bought by
Mitchell Sharon Lynn Merten
Home Financials for this Owner
Home Financials are based on the most recent Mortgage that was taken out on this home.
Original Mortgage
$119,050
Interest Rate
8.18%
Mortgage Type
Seller Take Back
Purchase Details
Closed on
Apr 8, 1996
Sold by
Schumacher James B and Schumacher Lucile D
Bought by
Merten H Russell and Merten Violet Alice
Create a Home Valuation Report for This Property
The Home Valuation Report is an in-depth analysis detailing your home's value as well as a comparison with similar homes in the area
Home Values in the Area
Average Home Value in this Area
Purchase History
| Date | Buyer | Sale Price | Title Company |
|---|---|---|---|
| Sirk Larry W | $120,000 | Attorney | |
| Deutsche Bank National Trust Company | $114,000 | None Available | |
| Mitchell Sharon Lynn Merten | $120,100 | -- | |
| Merten H Russell | $115,000 | -- |
Source: Public Records
Mortgage History
| Date | Status | Borrower | Loan Amount |
|---|---|---|---|
| Previous Owner | Mitchell Sharon Lynn Merten | $119,050 |
Source: Public Records
Tax History
| Year | Tax Paid | Tax Assessment Tax Assessment Total Assessment is a certain percentage of the fair market value that is determined by local assessors to be the total taxable value of land and additions on the property. | Land | Improvement |
|---|---|---|---|---|
| 2025 | $5,957 | $108,063 | $28,994 | $79,069 |
| 2023 | $5,412 | $108,063 | $28,994 | $79,069 |
| 2022 | $4,738 | $78,768 | $30,734 | $48,034 |
| 2021 | $4,601 | $78,768 | $30,734 | $48,034 |
| 2020 | $5,317 | $78,768 | $30,734 | $48,034 |
| 2019 | $5,426 | $74,309 | $28,994 | $45,315 |
| 2018 | $5,429 | $74,309 | $28,994 | $45,315 |
| 2017 | $5,198 | $74,309 | $28,994 | $45,315 |
| 2016 | $2,543 | $42,000 | $27,524 | $14,476 |
| 2015 | $2,573 | $42,000 | $27,524 | $14,476 |
| 2014 | $2,579 | $42,000 | $27,524 | $14,476 |
| 2013 | $3,868 | $59,294 | $24,798 | $34,496 |
Source: Public Records
Map
Nearby Homes
- 513 Chisholm Trail
- 204 Brocdorf Dr
- 206 Hilltop Ln
- 8674 Hollyhock Dr
- 745 Compton Rd
- 8768 Cavalier Dr
- 9441 Wyoming Point Place
- 9469 Beech Dr
- 350 Pleasant Hill Dr
- 429 Mccreary Ct
- 399 W Galbraith Rd
- 9458 Leebrook Dr
- 650 Allencrest Ct
- 704 W Galbraith Rd
- 357 Meadowcrest Rd
- 320 Reily Rd
- 712 W Galbraith Rd
- 816 Sabino Ct
- 7809 View Place Dr
- 1012 Mary Ln
- 503 Compton Rd
- 515 Compton Rd
- 519 Compton Rd
- 495 Compton Rd
- 504 Compton Rd
- 510 Compton Rd
- 327 Poage Farm Rd
- 487 Compton Rd
- 356 Hilltop Ln
- 514 Compton Rd
- 406 Meadow Ln
- 350 Hilltop Ln
- 360 Hilltop Ln
- 523 Compton Rd
- 496 Compton Rd
- 346 Hilltop Ln
- 335 Poage Farm Rd
- 412 Meadow Ln
- 518 Compton Rd
- 488 Compton Rd
Your Personal Tour Guide
Ask me questions while you tour the home.