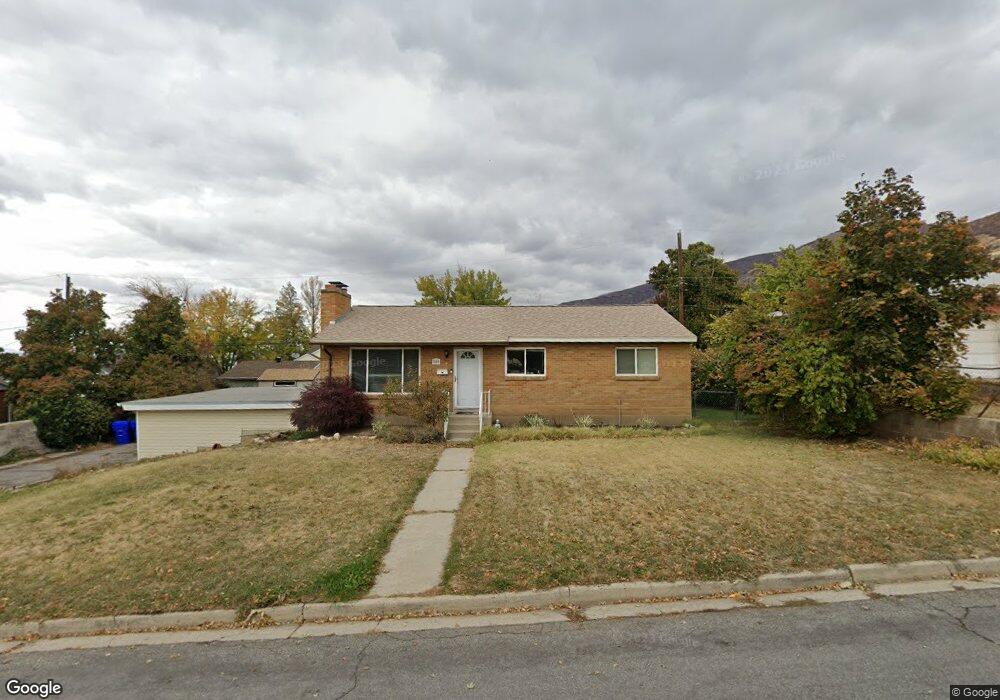
509 E 1130 N Bountiful, UT 84010
Estimated Value: $491,000 - $565,000
5
Beds
2
Baths
2,200
Sq Ft
$240/Sq Ft
Est. Value
About This Home
This home is located at 509 E 1130 N, Bountiful, UT 84010 and is currently estimated at $527,217, approximately $239 per square foot. 509 E 1130 N is a home located in Davis County with nearby schools including Tolman School, Bountiful Junior High School, and Viewmont High School.
Ownership History
Date
Name
Owned For
Owner Type
Purchase Details
Closed on
Dec 13, 2005
Sold by
Sears J Bradley and Sears Elizabeth A
Bought by
Dahl Garrit G and Dahl Tauni M
Current Estimated Value
Home Financials for this Owner
Home Financials are based on the most recent Mortgage that was taken out on this home.
Original Mortgage
$37,700
Outstanding Balance
$21,058
Interest Rate
6.36%
Mortgage Type
Stand Alone Second
Estimated Equity
$506,159
Purchase Details
Closed on
Feb 27, 1998
Sold by
Schwab Paul W and Schwab Zenda M
Bought by
Sears J Bradley and Sears Elizabeth A
Home Financials for this Owner
Home Financials are based on the most recent Mortgage that was taken out on this home.
Original Mortgage
$128,498
Interest Rate
6.99%
Mortgage Type
FHA
Purchase Details
Closed on
Feb 2, 1996
Sold by
Schwab Paul W
Bought by
Schwab Paul W and Schwab Zenda M
Home Financials for this Owner
Home Financials are based on the most recent Mortgage that was taken out on this home.
Original Mortgage
$65,000
Interest Rate
7.25%
Create a Home Valuation Report for This Property
The Home Valuation Report is an in-depth analysis detailing your home's value as well as a comparison with similar homes in the area
Purchase History
| Date | Buyer | Sale Price | Title Company |
|---|---|---|---|
| Dahl Garrit G | -- | Hickman Land Title Co | |
| Sears J Bradley | -- | Bonneville Title Company | |
| Schwab Paul W | -- | Bonneville Title Company Inc |
Source: Public Records
Mortgage History
| Date | Status | Borrower | Loan Amount |
|---|---|---|---|
| Open | Dahl Garrit G | $37,700 | |
| Open | Dahl Garrit G | $150,800 | |
| Previous Owner | Sears J Bradley | $128,498 | |
| Previous Owner | Schwab Paul W | $65,000 |
Source: Public Records
Tax History
| Year | Tax Paid | Tax Assessment Tax Assessment Total Assessment is a certain percentage of the fair market value that is determined by local assessors to be the total taxable value of land and additions on the property. | Land | Improvement |
|---|---|---|---|---|
| 2025 | $2,853 | $259,050 | $122,257 | $136,793 |
| 2024 | $2,677 | $252,450 | $112,892 | $139,558 |
| 2023 | $2,566 | $439,000 | $202,460 | $236,540 |
| 2022 | $2,713 | $255,200 | $107,499 | $147,701 |
| 2021 | $2,311 | $331,000 | $159,585 | $171,415 |
| 2020 | $2,035 | $292,000 | $145,360 | $146,640 |
| 2019 | $2,054 | $288,000 | $148,201 | $139,799 |
| 2018 | $1,964 | $263,000 | $136,979 | $126,021 |
| 2016 | $1,540 | $114,180 | $41,738 | $72,442 |
| 2015 | $1,555 | $109,120 | $42,349 | $66,771 |
| 2014 | $1,601 | $116,093 | $42,349 | $73,744 |
| 2013 | -- | $95,437 | $43,945 | $51,492 |
Source: Public Records
Map
Nearby Homes
- 662 E 1200 N
- 610 E Pages Ln
- 975 E 1050 N
- 1420 N Main St
- 453 N 400 E Unit 7-D
- 1023 E 800 N
- 967 S Courtyard Ln
- 345 N 400 E
- 908 Northern Hills Dr Unit 3
- 1105 E 600 N
- 345 E 600 S
- 933 Northern Hills Cir
- 683 E 100 N
- 96 Village Square Rd
- 610 S 800 E
- 16 W 780 S
- 951 Centerville Commons Way
- 106 W 700 N
- 495 E 475 S
- 1260 N 200 W
Your Personal Tour Guide
Ask me questions while you tour the home.