Estimated Value: $211,000 - $222,000
3
Beds
1
Bath
1,750
Sq Ft
$123/Sq Ft
Est. Value
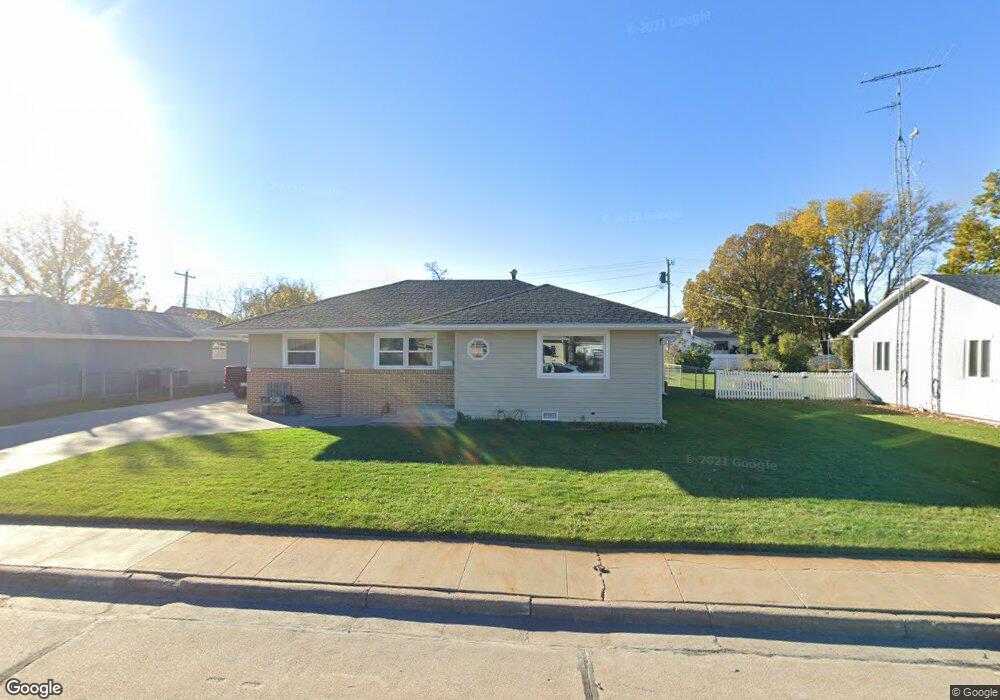
About This Home
This home is located at 509 E 13th St, Cozad, NE 69130 and is currently estimated at $215,368, approximately $123 per square foot. 509 E 13th St is a home located in Dawson County with nearby schools including Cozad Elementary School, Cozad Middle School, and Cozad High School.
Ownership History
Date
Name
Owned For
Owner Type
Purchase Details
Closed on
Dec 2, 2024
Sold by
Gydesen Spencer and Gydesen Mindy
Bought by
Larson Jesse and Higgins Sidney
Current Estimated Value
Home Financials for this Owner
Home Financials are based on the most recent Mortgage that was taken out on this home.
Original Mortgage
$172,000
Outstanding Balance
$141,731
Interest Rate
6.54%
Mortgage Type
Balloon
Estimated Equity
$73,637
Purchase Details
Closed on
Apr 2, 2018
Sold by
Smith Kevin and Smith Lisa
Bought by
Gydesen Spencer and Gydesen Mindy
Home Financials for this Owner
Home Financials are based on the most recent Mortgage that was taken out on this home.
Original Mortgage
$108,000
Interest Rate
4.4%
Mortgage Type
New Conventional
Create a Home Valuation Report for This Property
The Home Valuation Report is an in-depth analysis detailing your home's value as well as a comparison with similar homes in the area
Home Values in the Area
Average Home Value in this Area
Purchase History
| Date | Buyer | Sale Price | Title Company |
|---|---|---|---|
| Larson Jesse | $215,000 | None Listed On Document | |
| Larson Jesse | $215,000 | None Listed On Document | |
| Gydesen Spencer | $120,000 | None Available |
Source: Public Records
Mortgage History
| Date | Status | Borrower | Loan Amount |
|---|---|---|---|
| Open | Larson Jesse | $172,000 | |
| Closed | Larson Jesse | $172,000 | |
| Previous Owner | Gydesen Spencer | $108,000 |
Source: Public Records
Tax History
| Year | Tax Paid | Tax Assessment Tax Assessment Total Assessment is a certain percentage of the fair market value that is determined by local assessors to be the total taxable value of land and additions on the property. | Land | Improvement |
|---|---|---|---|---|
| 2025 | $2,586 | $171,936 | $7,836 | $164,100 |
| 2024 | $2,682 | $171,936 | $7,836 | $164,100 |
| 2023 | $3,451 | $159,796 | $5,877 | $153,919 |
| 2022 | $2,886 | $127,625 | $5,877 | $121,748 |
| 2021 | $2,600 | $125,236 | $5,877 | $119,359 |
| 2020 | $2,506 | $119,552 | $5,877 | $113,675 |
| 2019 | $2,459 | $117,880 | $5,875 | $112,005 |
| 2018 | $2,484 | $117,880 | $5,875 | $112,005 |
| 2017 | $2,494 | $117,880 | $5,875 | $112,005 |
| 2016 | $2,561 | $118,030 | $5,875 | $112,155 |
| 2015 | $2,572 | $117,882 | $5,877 | $112,005 |
| 2014 | $2,645 | $117,882 | $5,877 | $112,005 |
| 2013 | -- | $106,817 | $5,877 | $100,940 |
Source: Public Records
Map
Nearby Homes
Your Personal Tour Guide
Ask me questions while you tour the home.