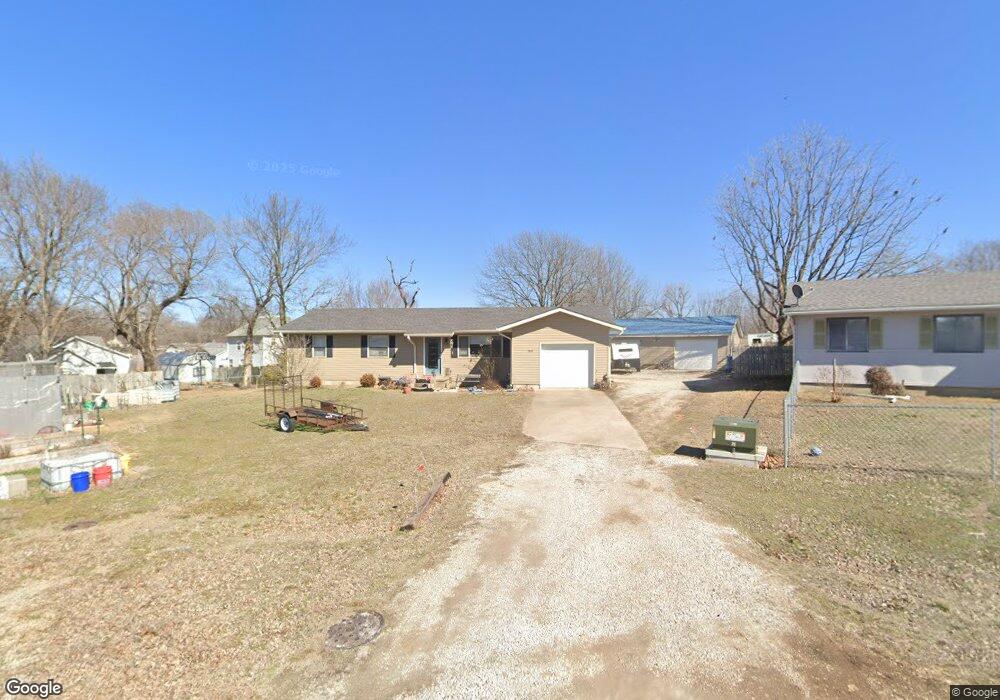
509 E 2nd St Carl Junction, MO 64834
Estimated Value: $181,966 - $197,000
4
Beds
2
Baths
1,258
Sq Ft
$149/Sq Ft
Est. Value
About This Home
This home is located at 509 E 2nd St, Carl Junction, MO 64834 and is currently estimated at $187,742, approximately $149 per square foot. 509 E 2nd St is a home located in Jasper County with nearby schools including Carl Junction Primary School (K-1), Carl Junction Intermediate School, and Carl Junction Primary School (2-3).
Ownership History
Date
Name
Owned For
Owner Type
Purchase Details
Closed on
Mar 27, 2020
Sold by
Cnj Developers Llc
Bought by
Utley Melissa F
Current Estimated Value
Home Financials for this Owner
Home Financials are based on the most recent Mortgage that was taken out on this home.
Original Mortgage
$120,772
Outstanding Balance
$106,524
Interest Rate
3.4%
Mortgage Type
FHA
Estimated Equity
$81,218
Purchase Details
Closed on
Apr 21, 2017
Sold by
Smith Bobby J
Bought by
Cnj Developers Inc
Purchase Details
Closed on
Apr 19, 2017
Sold by
Terry Thomas N and Terry Cara L
Bought by
Smith Bobby J
Purchase Details
Closed on
Jan 14, 2008
Sold by
Smith Harold D and Smith Karen M
Bought by
Terry Thomas N and Terry Bobbi J
Home Financials for this Owner
Home Financials are based on the most recent Mortgage that was taken out on this home.
Original Mortgage
$75,000
Interest Rate
5.94%
Mortgage Type
Purchase Money Mortgage
Create a Home Valuation Report for This Property
The Home Valuation Report is an in-depth analysis detailing your home's value as well as a comparison with similar homes in the area
Purchase History
| Date | Buyer | Sale Price | Title Company |
|---|---|---|---|
| Utley Melissa F | -- | None Available | |
| Cnj Developers Inc | -- | None Available | |
| Smith Bobby J | -- | None Available | |
| Terry Thomas N | -- | Barrister Title Services Llc |
Source: Public Records
Mortgage History
| Date | Status | Borrower | Loan Amount |
|---|---|---|---|
| Open | Utley Melissa F | $120,772 | |
| Previous Owner | Terry Thomas N | $75,000 |
Source: Public Records
Tax History
| Year | Tax Paid | Tax Assessment Tax Assessment Total Assessment is a certain percentage of the fair market value that is determined by local assessors to be the total taxable value of land and additions on the property. | Land | Improvement |
|---|---|---|---|---|
| 2025 | $941 | $18,190 | $1,410 | $16,780 |
| 2024 | $947 | $16,090 | $1,410 | $14,680 |
| 2023 | $947 | $16,090 | $1,410 | $14,680 |
| 2022 | $783 | $13,270 | $1,410 | $11,860 |
| 2021 | $672 | $13,270 | $1,410 | $11,860 |
| 2020 | $560 | $10,870 | $1,410 | $9,460 |
| 2019 | $532 | $10,870 | $1,410 | $9,460 |
| 2018 | $512 | $10,500 | $0 | $0 |
| 2016 | $538 | $11,090 | $0 | $0 |
Source: Public Records
Map
Nearby Homes
- 604 Pennell St
- 720 Sheridan Ave
- TBD Temple St
- 608 Valley View St
- 120 Concord St
- 503 S Main St
- 901 Aberdeen Ave
- 809 Aberdeen Ave
- 501 S Cowgill St
- 104 Cambridge Dr
- 304 Belgian Blue Blvd
- 900 Aberdeen Ave
- 805 Aberdeen Ave
- 1308 York St
- 804 Aberdeen Ave
- 806 Aberdeen Ave
- 808 Aberdeen Ave
- 903 Aberdeen Ave
- 505 N Broadway Ave
- 905 Aberdeen Ave
Your Personal Tour Guide
Ask me questions while you tour the home.