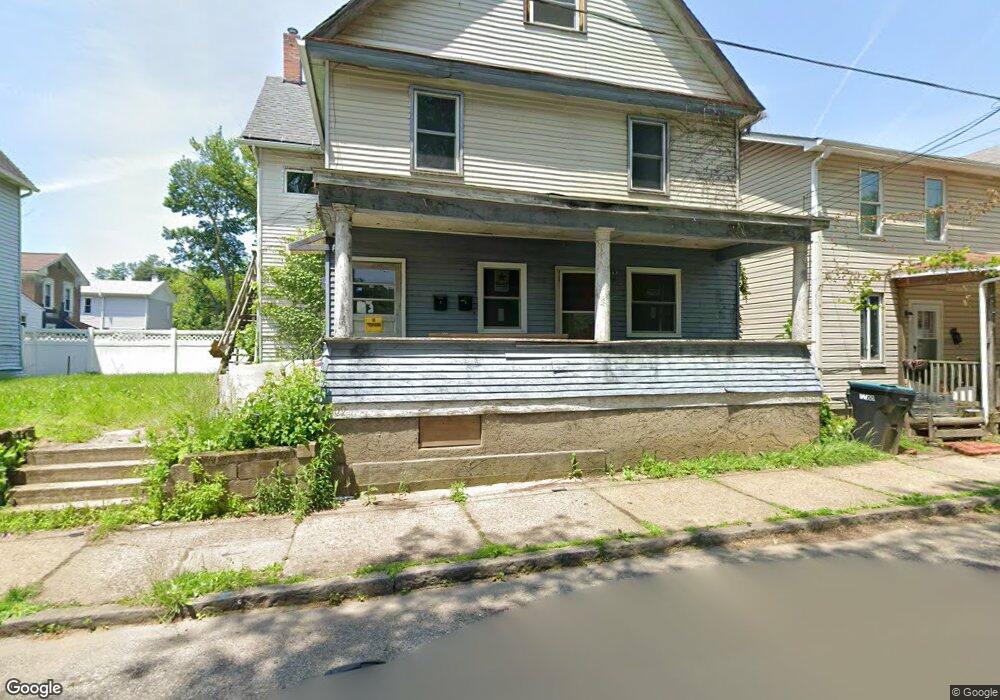
509 E 3rd Ave Tarentum, PA 15084
Estimated Value: $77,122 - $166,000
5
Beds
4
Baths
2,602
Sq Ft
$44/Sq Ft
Est. Value
About This Home
This home is located at 509 E 3rd Ave, Tarentum, PA 15084 and is currently estimated at $115,281, approximately $44 per square foot. 509 E 3rd Ave is a home located in Allegheny County with nearby schools including Highlands Senior High School, Mary Queen of Apostles School, and St. Joseph High School.
Ownership History
Date
Name
Owned For
Owner Type
Purchase Details
Closed on
Nov 6, 2024
Sold by
Commonwealth Invests L L C
Bought by
Martin Jeremy
Current Estimated Value
Purchase Details
Closed on
Oct 2, 2024
Sold by
Commonwealth Investmentsllc
Bought by
Martin Jeremy
Purchase Details
Closed on
Feb 27, 2018
Sold by
Farmer James D and Farmer Brittany L
Bought by
Commonwealth Investments Llc A Pennsylva
Purchase Details
Closed on
Jan 4, 2011
Sold by
Federal Home Loan Mortgage Corporation
Bought by
Ison Joseph
Purchase Details
Closed on
Oct 4, 2010
Sold by
Atlas Construction
Bought by
Federal Home Loan Mortgage Corporation
Purchase Details
Closed on
Oct 26, 2001
Sold by
Pakulski Patricia M
Bought by
Pennell Todd A
Create a Home Valuation Report for This Property
The Home Valuation Report is an in-depth analysis detailing your home's value as well as a comparison with similar homes in the area
Home Values in the Area
Average Home Value in this Area
Purchase History
| Date | Buyer | Sale Price | Title Company |
|---|---|---|---|
| Martin Jeremy | $7,000 | -- | |
| Martin Jeremy | $7,000 | -- | |
| Commonwealth Investments Llc A Pennsylva | $6,600 | Attorney | |
| Ison Joseph | $4,000 | -- | |
| Federal Home Loan Mortgage Corporation | -- | -- | |
| Pennell Todd A | $28,840 | -- |
Source: Public Records
Tax History
| Year | Tax Paid | Tax Assessment Tax Assessment Total Assessment is a certain percentage of the fair market value that is determined by local assessors to be the total taxable value of land and additions on the property. | Land | Improvement |
|---|---|---|---|---|
| 2025 | $834 | $23,600 | $7,600 | $16,000 |
| 2024 | $834 | $23,600 | $7,600 | $16,000 |
| 2023 | $834 | $23,600 | $7,600 | $16,000 |
| 2022 | $828 | $23,600 | $7,600 | $16,000 |
| 2021 | $112 | $23,600 | $7,600 | $16,000 |
| 2020 | $828 | $23,600 | $7,600 | $16,000 |
| 2019 | $822 | $23,600 | $7,600 | $16,000 |
| 2017 | $803 | $23,600 | $7,600 | $16,000 |
Source: Public Records
Map
Nearby Homes
Your Personal Tour Guide
Ask me questions while you tour the home.