Estimated Value: $78,000 - $101,168
2
Beds
1
Bath
984
Sq Ft
$89/Sq Ft
Est. Value
About This Home
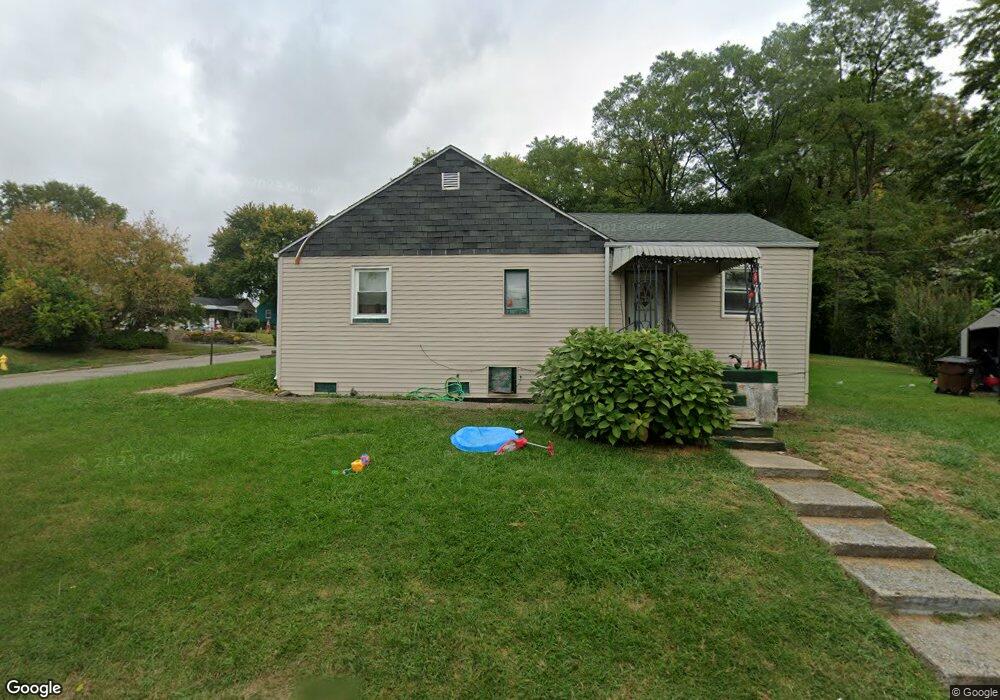
This home is located at 509 E 3rd St, Xenia, OH 45385 and is currently estimated at $88,042, approximately $89 per square foot. 509 E 3rd St is a home located in Greene County with nearby schools including Xenia High School, Summit Academy Community School for Alternative Learners - Xenia, and Legacy Christian Academy.
Ownership History
Date
Name
Owned For
Owner Type
Purchase Details
Closed on
May 16, 2018
Sold by
Siwo Michael A
Bought by
Shafer Jared P
Current Estimated Value
Home Financials for this Owner
Home Financials are based on the most recent Mortgage that was taken out on this home.
Original Mortgage
$30,150
Interest Rate
4.4%
Mortgage Type
New Conventional
Purchase Details
Closed on
Mar 31, 2014
Sold by
Matchem Herbert S
Bought by
Siwo Michael A
Home Financials for this Owner
Home Financials are based on the most recent Mortgage that was taken out on this home.
Original Mortgage
$12,560
Interest Rate
4.41%
Mortgage Type
New Conventional
Purchase Details
Closed on
Jun 26, 2003
Sold by
Jones Flora E
Bought by
Matchem Herbert S
Create a Home Valuation Report for This Property
The Home Valuation Report is an in-depth analysis detailing your home's value as well as a comparison with similar homes in the area
Home Values in the Area
Average Home Value in this Area
Purchase History
| Date | Buyer | Sale Price | Title Company |
|---|---|---|---|
| Shafer Jared P | $33,500 | Home Services Title Llc | |
| Siwo Michael A | $7,850 | None Available | |
| Matchem Herbert S | -- | -- |
Source: Public Records
Mortgage History
| Date | Status | Borrower | Loan Amount |
|---|---|---|---|
| Previous Owner | Shafer Jared P | $30,150 | |
| Previous Owner | Siwo Michael A | $12,560 |
Source: Public Records
Property History
| Date | Event | Price | List to Sale | Price per Sq Ft |
|---|---|---|---|---|
| 09/01/2024 09/01/24 | For Rent | $975 | -- | -- |
Tax History
| Year | Tax Paid | Tax Assessment Tax Assessment Total Assessment is a certain percentage of the fair market value that is determined by local assessors to be the total taxable value of land and additions on the property. | Land | Improvement |
|---|---|---|---|---|
| 2025 | $851 | $19,530 | $1,840 | $17,690 |
| 2024 | $851 | $19,530 | $1,840 | $17,690 |
| 2023 | $836 | $19,530 | $1,840 | $17,690 |
| 2022 | $698 | $13,920 | $1,680 | $12,240 |
| 2021 | $515 | $10,130 | $1,680 | $8,450 |
| 2020 | $493 | $10,130 | $1,680 | $8,450 |
| 2019 | $469 | $9,060 | $1,910 | $7,150 |
| 2018 | $471 | $9,060 | $1,910 | $7,150 |
| 2017 | $291 | $9,060 | $1,910 | $7,150 |
| 2016 | $291 | $5,500 | $1,910 | $3,590 |
| 2015 | $292 | $5,500 | $1,910 | $3,590 |
| 2014 | $443 | $8,710 | $1,910 | $6,800 |
Source: Public Records
Map
Nearby Homes
Your Personal Tour Guide
Ask me questions while you tour the home.