Estimated Value: $742,215 - $827,000
3
Beds
1
Bath
874
Sq Ft
$886/Sq Ft
Est. Value
About This Home
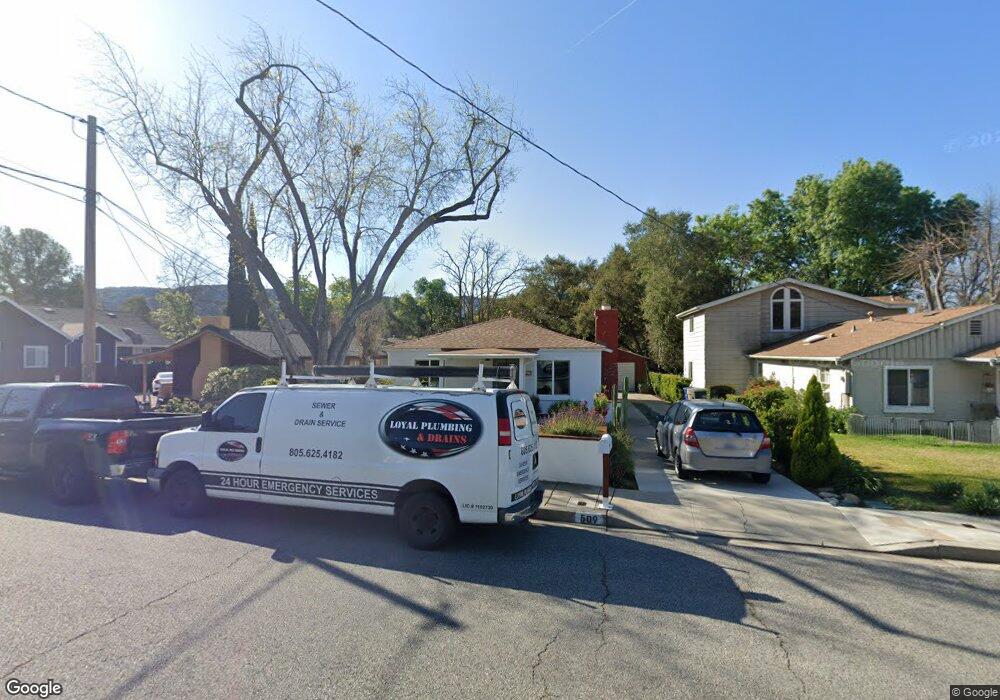
This home is located at 509 E Oak St, Ojai, CA 93023 and is currently estimated at $774,554, approximately $886 per square foot. 509 E Oak St is a home located in Ventura County with nearby schools including Topa Topa Elementary School, Meiners Oaks Elementary School, and Matilija Junior High.
Ownership History
Date
Name
Owned For
Owner Type
Purchase Details
Closed on
Jul 9, 2014
Sold by
Granholm Robin
Bought by
Granholm Robin
Current Estimated Value
Purchase Details
Closed on
Nov 18, 1996
Sold by
Ford Consumer Finance Co Inc
Bought by
Granholm Robin
Home Financials for this Owner
Home Financials are based on the most recent Mortgage that was taken out on this home.
Original Mortgage
$108,000
Outstanding Balance
$10,428
Interest Rate
7.86%
Estimated Equity
$764,126
Purchase Details
Closed on
Aug 29, 1996
Sold by
Crombie Bruce A and Crombie Susannah S
Bought by
Ford Consumer Finance Company Inc
Create a Home Valuation Report for This Property
The Home Valuation Report is an in-depth analysis detailing your home's value as well as a comparison with similar homes in the area
Home Values in the Area
Average Home Value in this Area
Purchase History
| Date | Buyer | Sale Price | Title Company |
|---|---|---|---|
| Granholm Robin | -- | None Available | |
| Granholm Robin | $135,000 | Benefit Land Title Ins Co | |
| Ford Consumer Finance Company Inc | $139,000 | Stewart Title |
Source: Public Records
Mortgage History
| Date | Status | Borrower | Loan Amount |
|---|---|---|---|
| Open | Granholm Robin | $108,000 |
Source: Public Records
Tax History
| Year | Tax Paid | Tax Assessment Tax Assessment Total Assessment is a certain percentage of the fair market value that is determined by local assessors to be the total taxable value of land and additions on the property. | Land | Improvement |
|---|---|---|---|---|
| 2025 | $3,615 | $219,837 | $146,569 | $73,268 |
| 2024 | $3,615 | $215,527 | $143,695 | $71,832 |
| 2023 | $3,496 | $211,301 | $140,877 | $70,424 |
| 2022 | $3,469 | $207,158 | $138,114 | $69,044 |
| 2021 | $3,438 | $203,097 | $135,406 | $67,691 |
| 2020 | $3,360 | $201,016 | $134,018 | $66,998 |
| 2019 | $3,272 | $197,076 | $131,391 | $65,685 |
| 2018 | $3,230 | $193,213 | $128,815 | $64,398 |
| 2017 | $3,180 | $189,426 | $126,290 | $63,136 |
| 2016 | $2,764 | $185,713 | $123,814 | $61,899 |
| 2015 | $2,736 | $182,925 | $121,955 | $60,970 |
| 2014 | $2,546 | $179,344 | $119,567 | $59,777 |
Source: Public Records
Map
Nearby Homes
- 310 E Matilija St
- 203 N Fulton St
- 216 N Fulton St
- 608 E Ojai Ave
- 207 E Eucalyptus St
- 401 S Fulton St
- 211 N Signal St
- 0 N Ventura Unit TR25015633
- 915 E Matilija St
- 211 Fox St
- 325 Bryant St
- 901 Grandview Ave
- 408 Canada St
- 309 S Signal St
- 113 S Blanche St
- 1201 Grand Ave
- 0 E Ojai Ave Unit 224929
- 0 E Ojai Ave Unit V1-33149
- 810 Libby Ave
- 910 Mercer Ave
Your Personal Tour Guide
Ask me questions while you tour the home.