J
Seller's Agent in 2019
Joseph Chase Sumner
Re/Max Of Albany

Estimated Value: $113,000 - $156,000
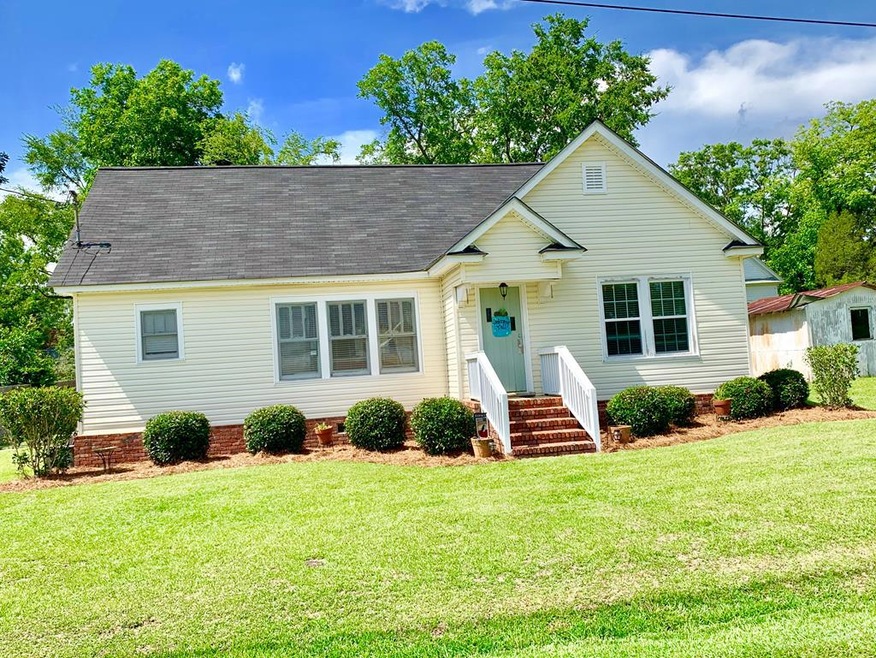
AMAZING 1224 SQ. FT. HOME LOCATED IN SYLVESTER GA.!!!!!!!! This home is perfect for anyone looking to become a first time homeowner or wanting to downsize. Beautiful original hardwood flooring runs throughout the large living room, dining room, hallway, and both bedrooms. The bedrooms have nice size closets and plenty of space for large bedroom furniture. The bathroom is located between both bedrooms and features tile flooring, a shower tub combo, and a very nice vanity. Just off of the formal dining room is the office/bonus room, this is a large open area the has vinyl flooring and leads into the kitchen. The kitchen features a lot of cabinet/counter space and even has a pantry area. This property is being sold as-is, Call today to schedule your private tour !!!!!!
Last Agent to Sell the Property
Joseph Chase Sumner
Re/Max Of Albany Brokerage Phone: 2294341600 License #380794 Listed on: 06/29/2019
Last Buyer's Agent
Non-Member Agent
Non Member Office
| Date | Buyer | Sale Price | Title Company |
|---|---|---|---|
| Harrell Sheree | $72,500 | -- | |
| Braswell Kristin | -- | -- | |
| Braswell Kevin | $65,000 | -- |
| Date | Status | Borrower | Loan Amount |
|---|---|---|---|
| Open | Harrell Sheree | $75,757 | |
| Previous Owner | Braswell Kevin | $63,822 |
| Date | Event | Price | List to Sale | Price per Sq Ft |
|---|---|---|---|---|
| 08/09/2019 08/09/19 | Sold | $72,500 | -- | $59 / Sq Ft |
| 06/29/2019 06/29/19 | Pending | -- | -- | -- |
| Year | Tax Paid | Tax Assessment Tax Assessment Total Assessment is a certain percentage of the fair market value that is determined by local assessors to be the total taxable value of land and additions on the property. | Land | Improvement |
|---|---|---|---|---|
| 2025 | $1,498 | $56,138 | $8,000 | $48,138 |
| 2024 | $616 | $16,673 | $3,226 | $13,447 |
| 2023 | $616 | $16,673 | $3,226 | $13,447 |
| 2022 | $600 | $16,673 | $3,226 | $13,447 |
| 2021 | $599 | $16,673 | $3,226 | $13,447 |
| 2020 | $600 | $16,673 | $3,226 | $13,447 |
| 2019 | $599 | $16,673 | $3,226 | $13,447 |
| 2018 | $565 | $16,673 | $3,226 | $13,447 |
| 2017 | $565 | $16,673 | $3,226 | $13,447 |
| 2016 | $599 | $16,673 | $3,226 | $13,447 |
| 2015 | $566 | $16,673 | $3,226 | $13,447 |
| 2014 | $566 | $16,673 | $3,226 | $13,447 |
| 2013 | -- | $16,673 | $3,226 | $13,447 |
| 2012 | -- | $16,672 | $3,225 | $13,447 |
J
Seller's Agent in 2019
Joseph Chase Sumner
Re/Max Of Albany
N
Buyer's Agent in 2019
Non-Member Agent
Non Member Office
Source: Albany Board of REALTORS®
MLS Number: 143325
APN: SV130-046-000
Ask me questions while you tour the home.