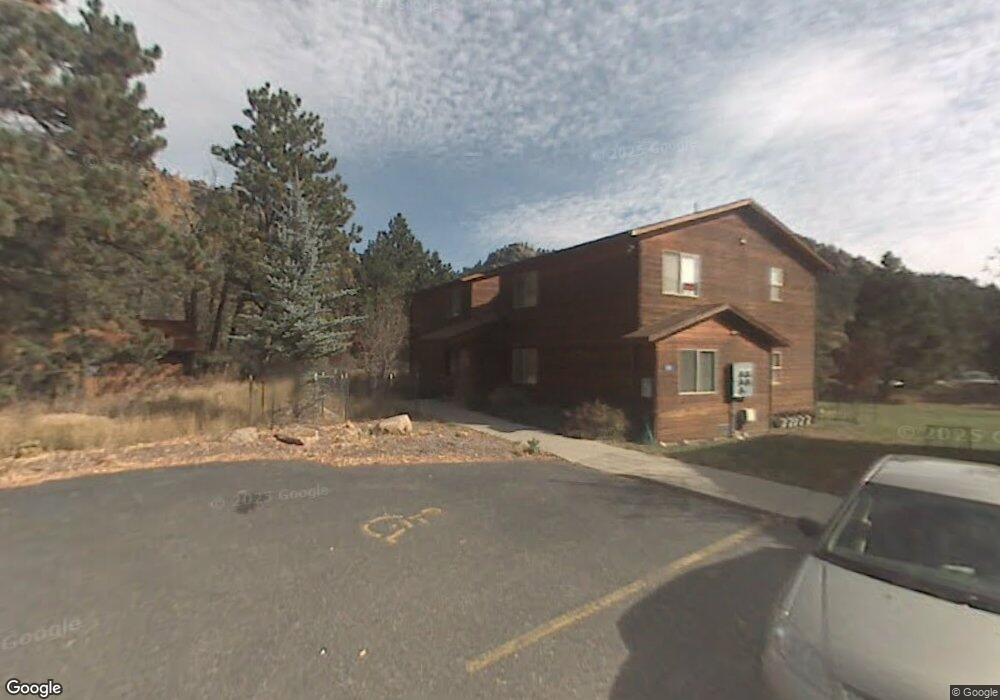
509 Fall River Ln Unit A Estes Park, CO 80517
Estimated Value: $326,000 - $385,110
2
Beds
1
Bath
724
Sq Ft
$499/Sq Ft
Est. Value
About This Home
This home is located at 509 Fall River Ln Unit A, Estes Park, CO 80517 and is currently estimated at $361,278, approximately $499 per square foot. 509 Fall River Ln Unit A is a home located in Larimer County with nearby schools including Estes Park K-5 School, Estes Park Options School, and Estes Park Middle School.
Ownership History
Date
Name
Owned For
Owner Type
Purchase Details
Closed on
Sep 12, 2022
Sold by
Moss Brook Llc
Bought by
Haber Elsa Guakil
Current Estimated Value
Purchase Details
Closed on
Aug 15, 2022
Sold by
Lovelace Caroline S
Bought by
Moss Brook Llc
Purchase Details
Closed on
Jul 12, 2017
Sold by
Naughton Elizabeth R and Heckel Catherine M
Bought by
Lovelace Caroline S
Purchase Details
Closed on
May 18, 2001
Sold by
Naughton Elizabeth R
Bought by
Naughton Elizabeth R and Heckel Catherine M
Home Financials for this Owner
Home Financials are based on the most recent Mortgage that was taken out on this home.
Original Mortgage
$87,200
Interest Rate
7.37%
Purchase Details
Closed on
Dec 10, 1999
Sold by
Johnson W K Lin & Maria H Y Lin Trust
Bought by
Naughton Elizabeth R
Home Financials for this Owner
Home Financials are based on the most recent Mortgage that was taken out on this home.
Original Mortgage
$73,500
Interest Rate
7.86%
Create a Home Valuation Report for This Property
The Home Valuation Report is an in-depth analysis detailing your home's value as well as a comparison with similar homes in the area
Home Values in the Area
Average Home Value in this Area
Purchase History
| Date | Buyer | Sale Price | Title Company |
|---|---|---|---|
| Haber Elsa Guakil | $315,000 | -- | |
| Moss Brook Llc | $270,000 | None Listed On Document | |
| Lovelace Caroline S | $245,000 | North American Title Company | |
| Naughton Elizabeth R | -- | Attorneys Title 959 | |
| Naughton Elizabeth R | $91,900 | -- |
Source: Public Records
Mortgage History
| Date | Status | Borrower | Loan Amount |
|---|---|---|---|
| Previous Owner | Naughton Elizabeth R | $87,200 | |
| Previous Owner | Naughton Elizabeth R | $73,500 |
Source: Public Records
Tax History Compared to Growth
Tax History
| Year | Tax Paid | Tax Assessment Tax Assessment Total Assessment is a certain percentage of the fair market value that is determined by local assessors to be the total taxable value of land and additions on the property. | Land | Improvement |
|---|---|---|---|---|
| 2025 | $1,495 | $24,100 | $1,668 | $22,432 |
| 2024 | $1,470 | $24,100 | $1,668 | $22,432 |
| 2022 | $1,362 | $17,841 | $1,731 | $16,110 |
| 2021 | $1,399 | $18,354 | $1,780 | $16,574 |
| 2020 | $1,385 | $17,939 | $1,780 | $16,159 |
| 2019 | $1,377 | $17,939 | $1,780 | $16,159 |
| 2018 | $977 | $12,341 | $1,793 | $10,548 |
| 2017 | $982 | $12,341 | $1,793 | $10,548 |
| 2016 | $917 | $12,211 | $1,982 | $10,229 |
| 2015 | $926 | $12,210 | $1,980 | $10,230 |
| 2014 | $884 | $11,950 | $1,980 | $9,970 |
Source: Public Records
Map
Nearby Homes
- 507 Fall River Ln Unit A
- 0 W Elkhorn Ave
- 300 Far View Dr Unit 7
- 300 Far View Dr Unit 15
- 321 Big Horn Dr Unit E4
- 1895 Fall River Rd
- 677 Cedar Ridge Cir Unit 5
- 658 Cedar Ridge Cir Unit 1
- 242 Virginia Dr
- 131 Willowstone Ct
- 683 Cedar Ridge Cir Unit 2
- 6161 36
- 476 Macgregor Ave Unit A3
- 647 Park River Place Unit 647
- 220 Virginia Dr Unit 8
- 465 Pine River Ln
- 620 Park River Place Unit 620
- 269 Steamer Ct
- 206 Twin Owls Ln
- 810 Larkspur Rd
- 509 Fall River Ln Unit D
- 509 Fall River Ln Unit C
- 509 Fall River Ln Unit B
- 509 Fall River Ln
- 507 Fall River Ln Unit D
- 507 Fall River Ln Unit C
- 507 Fall River Ln Unit B
- 507 Fall River Ln
- 507 Fall River Ln Unit 507
- 505 Fall River Ln Unit D
- 505 Fall River Ln Unit C
- 505 Fall River Ln Unit B
- 505 Fall River Ln Unit A
- 505 Fall River Ln
- 1130 W Elkhorn Ave
- 503 Fall River Ln Unit D
- 503 Fall River Ln Unit C
- 503 Fall River Ln Unit B
- 503 Fall River Ln Unit A
- 1152 W Elkhorn Ave