A
Seller's Agent in 2025
Amanda Wiley & K Team
Era All In One Realty
(229) 888-6670
121 in this area
2,617 Total Sales
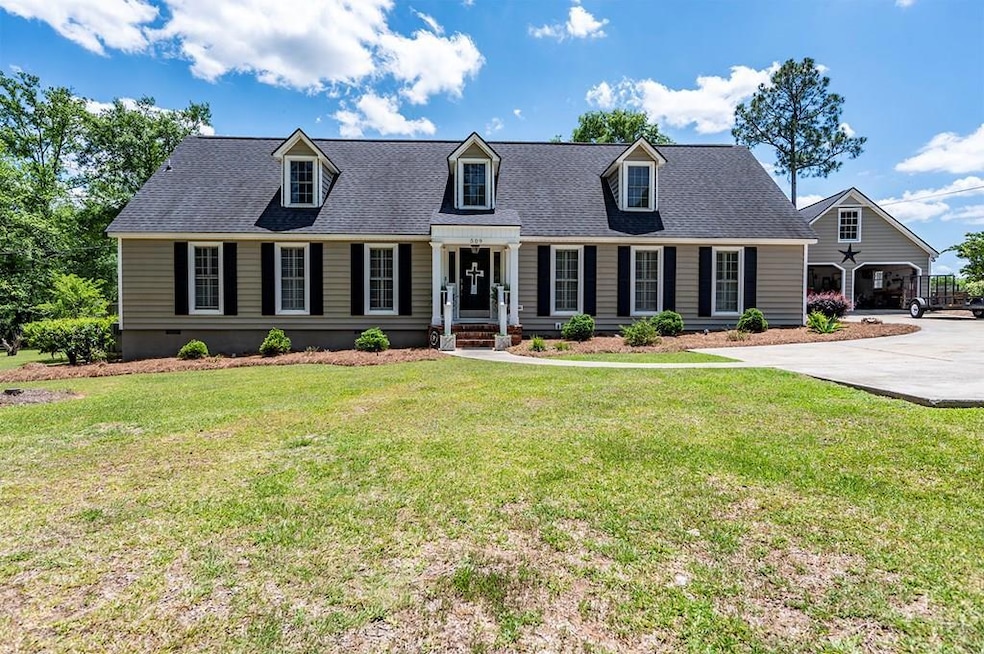
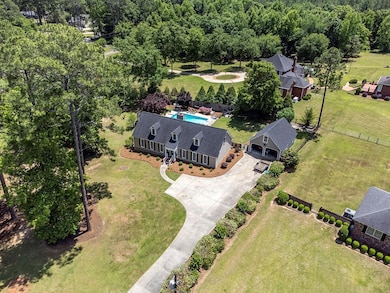
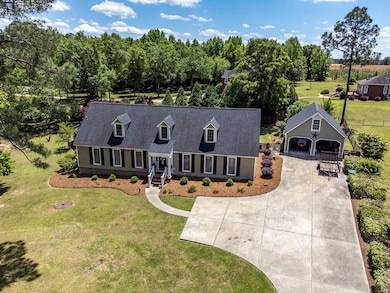
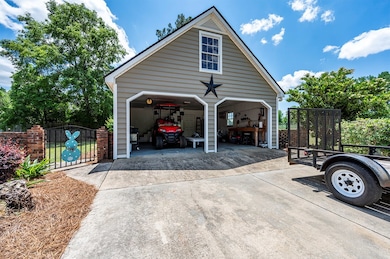
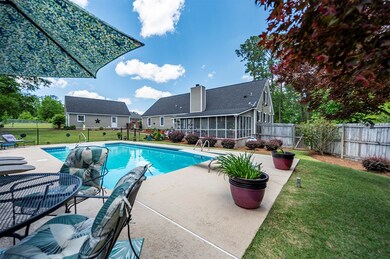

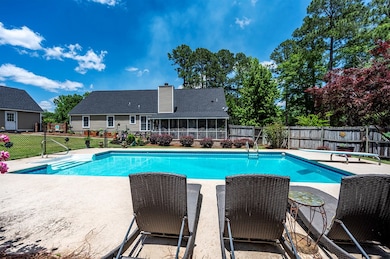
~ DIVE IN TO THIS TERRELL COUNTY HOME ON 1.11 ACRES + IN-GROUND POOL ~ LOCATED IN A PRESTIGEOUS NEIGHBORHOOD ~ FULL OF UPGRADES, UPDATES & CHARACHTER GALORE ~ The Minutes away from the golf course! This immaculate 4-bedroom 3 bath home boasts 2845 sqft with an exceptional floorplan! Spacious living room with hardwood floors, fireplace and French doors that leads to the screened in porch! Amazing kitchen includes updated custom cabinets, granite, stainless appliances, double ovens, island with breakfast bar seating and an open formal dining room area! Downstairs is the owner's suite and two extra bedrooms! The Primary Suite features his/hers closets and private bathroom that has double vanities with granite countertops and a tiled and pretty glass shower! The additional bedrooms are spacious with ample closet space! Upstairs is the huge 4th bedroom/bonus room space that has its own bathroom, this is perfect for a mother-in-law suite, game room or teenage headquarters! Outside is an OASIS for everyone with so much privacy and plush landscaping! Entertaining and grilling delight! 16x36 vinyl liner pool that has loads of lounging space, screened in porch, A detached double garage with extra storage on the second floor of it! ROOF in 2019! New pool Pump! Plantation shutters on the inside of the house! Tankless water heater! Termite bond and dehumidifier! Wonderful location closet to everything in Dawson and only 20 mins to Albany!
Last Agent to Sell the Property
Era All In One Realty Brokerage Phone: 2298886670 License #309999 Listed on: 05/05/2025
Last Buyer's Agent
Non-Member Agent
Non Member Office
| Date | Type | Sale Price | Title Company |
|---|---|---|---|
| Warranty Deed | $359,900 | -- | |
| Warranty Deed | $310,000 | -- | |
| Deed | $215,000 | -- | |
| Deed | $136,000 | -- |
| Date | Status | Loan Amount | Loan Type |
|---|---|---|---|
| Open | $1,040,030 | New Conventional | |
| Previous Owner | $286,478 | New Conventional | |
| Previous Owner | $35,000 | Commercial | |
| Previous Owner | $199,994 | FHA | |
| Previous Owner | $211,678 | FHA |
| Date | Event | Price | List to Sale | Price per Sq Ft | Prior Sale |
|---|---|---|---|---|---|
| 06/29/2025 06/29/25 | Off Market | $359,900 | -- | -- | |
| 06/17/2025 06/17/25 | Sold | $359,900 | 0.0% | $127 / Sq Ft | |
| 05/10/2025 05/10/25 | Pending | -- | -- | -- | |
| 05/05/2025 05/05/25 | For Sale | $359,900 | +16.1% | $127 / Sq Ft | |
| 10/06/2023 10/06/23 | Sold | $310,000 | -- | $109 / Sq Ft | View Prior Sale |
| 09/06/2023 09/06/23 | Pending | -- | -- | -- |
| Year | Tax Paid | Tax Assessment Tax Assessment Total Assessment is a certain percentage of the fair market value that is determined by local assessors to be the total taxable value of land and additions on the property. | Land | Improvement |
|---|---|---|---|---|
| 2024 | $2,446 | $58,335 | $5,750 | $52,585 |
| 2023 | $2,447 | $58,335 | $5,750 | $52,585 |
| 2022 | $1,745 | $58,335 | $5,750 | $52,585 |
| 2021 | $1,745 | $58,335 | $5,750 | $52,585 |
| 2020 | $1,745 | $58,335 | $5,750 | $52,585 |
| 2019 | $1,689 | $58,335 | $5,750 | $52,585 |
| 2018 | $1,689 | $58,335 | $5,750 | $52,585 |
| 2017 | $2,222 | $58,335 | $5,750 | $52,585 |
| 2016 | $1,689 | $58,335 | $5,750 | $52,585 |
| 2015 | -- | $58,335 | $5,750 | $52,585 |
| 2014 | -- | $58,335 | $5,750 | $52,585 |
| 2013 | -- | $58,335 | $5,750 | $52,585 |
A
Seller's Agent in 2025
Amanda Wiley & K Team
Era All In One Realty
(229) 888-6670
121 in this area
2,617 Total Sales
N
Buyer's Agent in 2025
Non-Member Agent
Non Member Office

Seller's Agent in 2023
KATIE HUGHEY GATEWOOD
Hughey & Neuman, Inc.
(229) 881-0743
5 in this area
249 Total Sales
Source: Albany Board of REALTORS®
MLS Number: 164861
APN: 031A-028