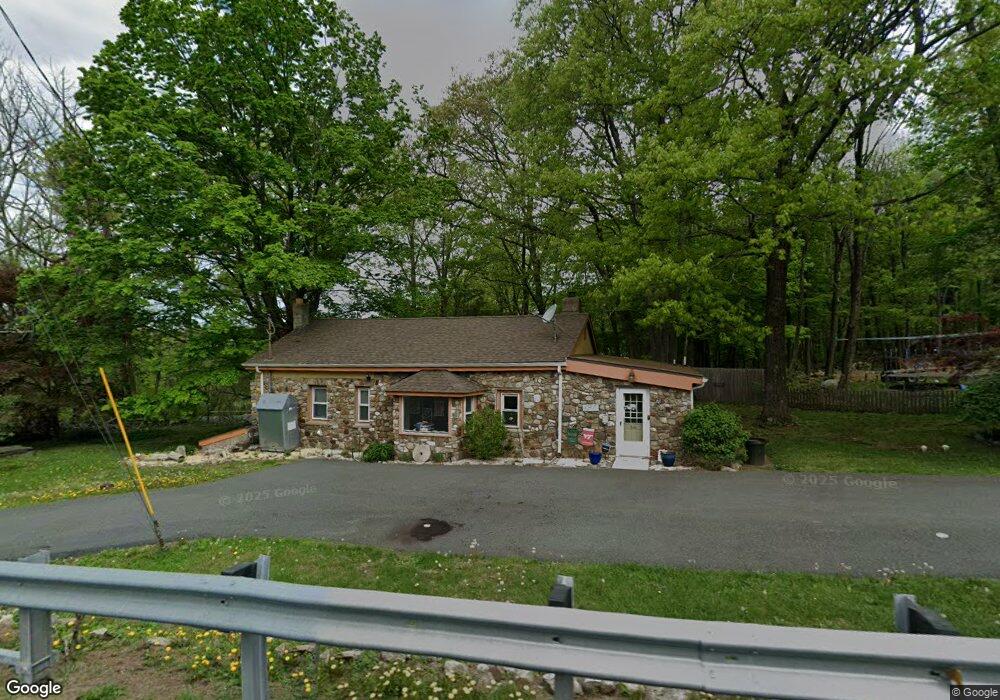
509 Glen Rd Sparta, NJ 07871
Estimated Value: $274,000 - $532,000
--
Bed
--
Bath
1,535
Sq Ft
$274/Sq Ft
Est. Value
About This Home
This home is located at 509 Glen Rd, Sparta, NJ 07871 and is currently estimated at $420,747, approximately $274 per square foot. 509 Glen Rd is a home located in Sussex County with nearby schools including Sparta High School and Alpine Montessori - Sparta.
Ownership History
Date
Name
Owned For
Owner Type
Purchase Details
Closed on
Oct 21, 2025
Sold by
Picardi Justine Michele
Bought by
Burdzy Kristen and Burdzy Brian
Current Estimated Value
Home Financials for this Owner
Home Financials are based on the most recent Mortgage that was taken out on this home.
Original Mortgage
$300,000
Outstanding Balance
$300,000
Interest Rate
6.26%
Mortgage Type
VA
Estimated Equity
$120,747
Purchase Details
Closed on
Feb 23, 2019
Sold by
Picardi Justine Michele and Picardi Michael
Bought by
Picardi Justine Michele
Purchase Details
Closed on
May 18, 2016
Sold by
Cronin Richard and Cronin Eileen
Bought by
Oicardi Justine Michele and Oicardi Michael
Purchase Details
Closed on
Oct 12, 1999
Sold by
Howell Richard J and Howell Barry J
Bought by
Cronin Richard and Cronin Eileen
Home Financials for this Owner
Home Financials are based on the most recent Mortgage that was taken out on this home.
Original Mortgage
$104,000
Interest Rate
7.83%
Create a Home Valuation Report for This Property
The Home Valuation Report is an in-depth analysis detailing your home's value as well as a comparison with similar homes in the area
Home Values in the Area
Average Home Value in this Area
Purchase History
| Date | Buyer | Sale Price | Title Company |
|---|---|---|---|
| Burdzy Kristen | $350,000 | Realsafe Title | |
| Picardi Justine Michele | $126,672 | Stewart Title Company | |
| Oicardi Justine Michele | $140,000 | Chicago Title Ins Co | |
| Cronin Richard | $130,000 | -- |
Source: Public Records
Mortgage History
| Date | Status | Borrower | Loan Amount |
|---|---|---|---|
| Open | Burdzy Kristen | $300,000 | |
| Previous Owner | Cronin Richard | $104,000 |
Source: Public Records
Tax History Compared to Growth
Tax History
| Year | Tax Paid | Tax Assessment Tax Assessment Total Assessment is a certain percentage of the fair market value that is determined by local assessors to be the total taxable value of land and additions on the property. | Land | Improvement |
|---|---|---|---|---|
| 2025 | $8,578 | $239,000 | $117,500 | $121,500 |
| 2024 | $8,332 | $239,000 | $117,500 | $121,500 |
| 2023 | $8,332 | $239,000 | $117,500 | $121,500 |
| 2022 | $8,131 | $239,000 | $117,500 | $121,500 |
| 2021 | $8,002 | $239,000 | $117,500 | $121,500 |
| 2020 | $8,126 | $239,000 | $117,500 | $121,500 |
| 2019 | $7,916 | $239,000 | $117,500 | $121,500 |
| 2018 | $7,748 | $239,000 | $117,500 | $121,500 |
| 2017 | $7,653 | $239,000 | $117,500 | $121,500 |
| 2016 | $7,474 | $239,000 | $117,500 | $121,500 |
| 2015 | $5,336 | $137,200 | $69,400 | $67,800 |
| 2014 | $5,249 | $137,200 | $69,400 | $67,800 |
Source: Public Records
Map
Nearby Homes
- 524 Glen Rd
- 10 Spring Ave
- 506 Glen Rd
- 14 Nazarene Ln
- 507 Glen Rd
- 18 Nazarene Ln
- 518 Glen Rd
- 1 Margaret Terrace
- 16 Nazarene Ln Unit 1A
- 532 Glen Rd
- 11 Margaret Terrace Unit A
- 9 Margaret Terrace
- 17 Margaret Terrace
- 18 Spring Ave Unit A
- 16 Spring Ave
- 2 Margaret Terrace
- 4 Margaret Terrace Unit D
- 15 Margaret Terrace Unit A
- 540 Glen Rd
- 529 Glen Rd