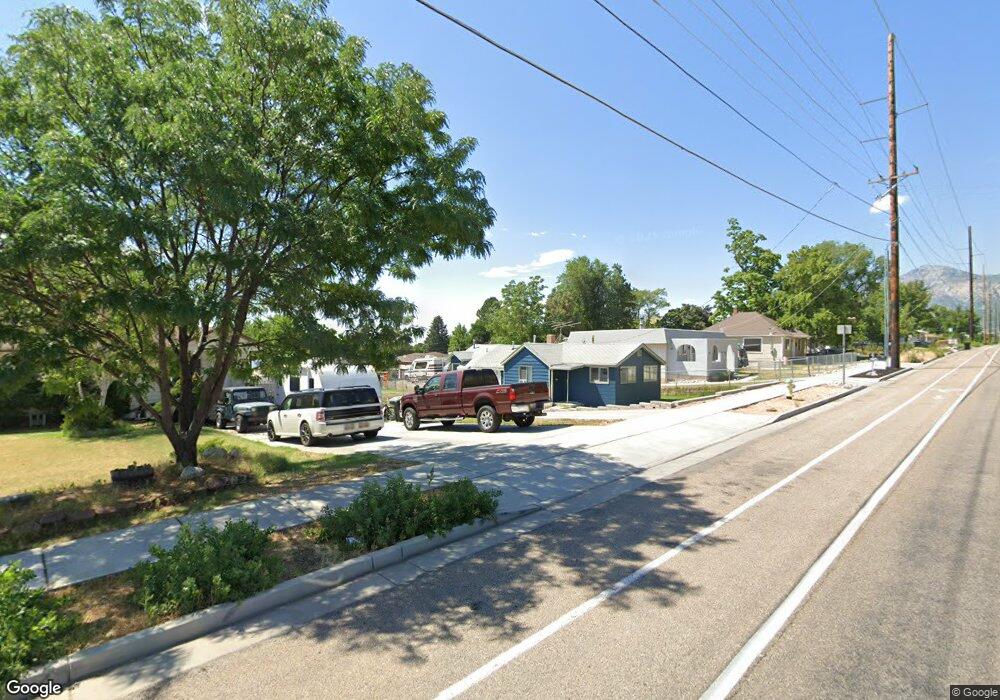
509 Harrison Blvd Ogden, UT 84404
Hillcrest-Bonneville NeighborhoodEstimated Value: $329,000 - $346,000
2
Beds
1
Bath
900
Sq Ft
$374/Sq Ft
Est. Value
About This Home
This home is located at 509 Harrison Blvd, Ogden, UT 84404 and is currently estimated at $336,756, approximately $374 per square foot. 509 Harrison Blvd is a home located in Weber County with nearby schools including Highland Junior High School and Ben Lomond High School.
Ownership History
Date
Name
Owned For
Owner Type
Purchase Details
Closed on
Feb 24, 2022
Sold by
Blue Mountain Partners Llc
Bought by
Wyatt Doug
Current Estimated Value
Home Financials for this Owner
Home Financials are based on the most recent Mortgage that was taken out on this home.
Original Mortgage
$231,200
Outstanding Balance
$216,015
Interest Rate
3.92%
Mortgage Type
New Conventional
Estimated Equity
$120,741
Purchase Details
Closed on
Nov 1, 2019
Sold by
Cup Holdings Llc
Bought by
Blue Mountain Partners Llc
Purchase Details
Closed on
Jun 27, 2019
Sold by
Bm Re Llc
Bought by
Cup Holdings Llc
Home Financials for this Owner
Home Financials are based on the most recent Mortgage that was taken out on this home.
Original Mortgage
$800,250
Interest Rate
4%
Mortgage Type
Commercial
Create a Home Valuation Report for This Property
The Home Valuation Report is an in-depth analysis detailing your home's value as well as a comparison with similar homes in the area
Home Values in the Area
Average Home Value in this Area
Purchase History
| Date | Buyer | Sale Price | Title Company |
|---|---|---|---|
| Wyatt Doug | -- | Stewart Title Company | |
| Blue Mountain Partners Llc | -- | Accommodation | |
| Cup Holdings Llc | -- | Capstone T&E Inc |
Source: Public Records
Mortgage History
| Date | Status | Borrower | Loan Amount |
|---|---|---|---|
| Open | Wyatt Doug | $231,200 | |
| Previous Owner | Cup Holdings Llc | $800,250 |
Source: Public Records
Tax History Compared to Growth
Tax History
| Year | Tax Paid | Tax Assessment Tax Assessment Total Assessment is a certain percentage of the fair market value that is determined by local assessors to be the total taxable value of land and additions on the property. | Land | Improvement |
|---|---|---|---|---|
| 2025 | $2,357 | $308,352 | $103,720 | $204,632 |
| 2024 | $2,239 | $160,049 | $57,044 | $103,005 |
| 2023 | $2,034 | $146,300 | $50,986 | $95,314 |
| 2022 | $1,689 | $120,450 | $43,979 | $76,471 |
| 2021 | $1,362 | $157,000 | $49,997 | $107,003 |
| 2020 | $1,211 | $127,000 | $36,617 | $90,383 |
| 2019 | $1,165 | $114,000 | $32,287 | $81,713 |
| 2018 | $985 | $93,000 | $27,935 | $65,065 |
| 2017 | $1,041 | $93,000 | $26,943 | $66,057 |
| 2016 | $813 | $37,392 | $15,122 | $22,270 |
| 2015 | $751 | $33,991 | $15,257 | $18,734 |
| 2014 | $755 | $33,929 | $14,301 | $19,628 |
Source: Public Records
Map
Nearby Homes
- 1243 Hudson St
- 622 Brinker Ave
- 1274 5th St
- 1302 Harrop St
- 3088 N 3075 W
- 261 Van Buren Ave
- 1363 Lewis Dr
- 446 Robins Ave
- 3270 N 3325 W Unit 386B
- 462 Hiland Rd
- 727 Robins Ave
- 1120 Cross St
- 1427 Sheridan Dr
- 1034 1st St
- 1024 1st St
- 777 Simoron Dr
- 1568 Hudson St Unit 1
- 597 Quinn Ct
- 619 Quinn Ct
- 131 Taylor Ave
- 501 Harrison Blvd
- 515 Harrison Blvd
- 501 Harrison Blvd
- 459 Harrison Blvd
- 523 Harrison Blvd
- 526 Brinker Ave
- 536 Brinker Ave
- 525 S Harrison Blvd
- 453 Harrison Blvd
- 525 Harrison Blvd
- 518 Brinker Ave
- 548 Brinker Ave
- 504 Harrison Blvd
- 510 Brinker Ave
- 1203 Hudson St
- 445 Harrison Blvd
- 533 Harrison Blvd
- 558 Brinker Ave
- 504 Brinker Ave
- 496 Harrison Blvd