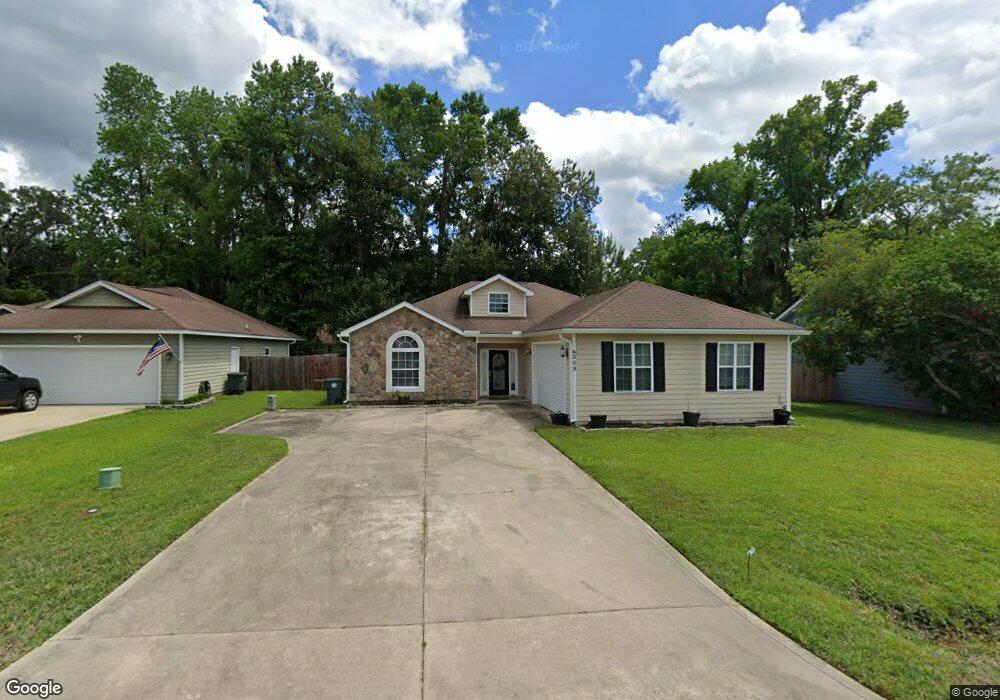
509 Hide Away Lake Loop Kingsland, GA 31548
Estimated Value: $275,016 - $293,000
3
Beds
2
Baths
1,498
Sq Ft
$190/Sq Ft
Est. Value
About This Home
This home is located at 509 Hide Away Lake Loop, Kingsland, GA 31548 and is currently estimated at $285,004, approximately $190 per square foot. 509 Hide Away Lake Loop is a home located in Camden County with nearby schools including Kingsland Elementary School, Camden Middle School, and Camden County High School.
Ownership History
Date
Name
Owned For
Owner Type
Purchase Details
Closed on
Jun 24, 2022
Sold by
Wenson Jordan
Bought by
Valentine Jakob Dylan
Current Estimated Value
Home Financials for this Owner
Home Financials are based on the most recent Mortgage that was taken out on this home.
Original Mortgage
$264,957
Outstanding Balance
$251,731
Interest Rate
5.1%
Mortgage Type
VA
Estimated Equity
$33,273
Purchase Details
Closed on
Feb 19, 2016
Sold by
Martinez Librado L
Bought by
Wenson Jordan L
Home Financials for this Owner
Home Financials are based on the most recent Mortgage that was taken out on this home.
Original Mortgage
$161,397
Interest Rate
3.81%
Mortgage Type
VA
Purchase Details
Closed on
Nov 30, 2009
Sold by
Westco General Contracting
Bought by
Marquez Librado L
Home Financials for this Owner
Home Financials are based on the most recent Mortgage that was taken out on this home.
Original Mortgage
$159,354
Interest Rate
5.01%
Mortgage Type
VA
Create a Home Valuation Report for This Property
The Home Valuation Report is an in-depth analysis detailing your home's value as well as a comparison with similar homes in the area
Home Values in the Area
Average Home Value in this Area
Purchase History
| Date | Buyer | Sale Price | Title Company |
|---|---|---|---|
| Valentine Jakob Dylan | $259,000 | -- | |
| Wenson Jordan L | $158,000 | -- | |
| Marquez Librado L | $156,000 | -- |
Source: Public Records
Mortgage History
| Date | Status | Borrower | Loan Amount |
|---|---|---|---|
| Open | Valentine Jakob Dylan | $264,957 | |
| Previous Owner | Wenson Jordan L | $161,397 | |
| Previous Owner | Marquez Librado L | $159,354 |
Source: Public Records
Tax History Compared to Growth
Tax History
| Year | Tax Paid | Tax Assessment Tax Assessment Total Assessment is a certain percentage of the fair market value that is determined by local assessors to be the total taxable value of land and additions on the property. | Land | Improvement |
|---|---|---|---|---|
| 2024 | $3,384 | $98,128 | $10,000 | $88,128 |
| 2023 | $3,375 | $94,128 | $6,000 | $88,128 |
| 2022 | $2,809 | $78,584 | $6,000 | $72,584 |
| 2021 | $2,594 | $67,698 | $6,000 | $61,698 |
| 2020 | $508 | $63,512 | $6,000 | $57,512 |
| 2019 | $2,527 | $63,512 | $6,000 | $57,512 |
| 2018 | $517 | $63,512 | $6,000 | $57,512 |
| 2017 | $2,248 | $58,270 | $6,000 | $52,270 |
| 2016 | $1,686 | $56,324 | $6,000 | $50,324 |
| 2015 | $2,083 | $56,323 | $6,000 | $50,324 |
| 2014 | $2,076 | $56,324 | $6,000 | $50,324 |
Source: Public Records
Map
Nearby Homes
- 508 Hide-A-way Lake Loop
- 522 Hide-A-way Lake Loop
- 524 Hide-A-way Lake Loop
- 233 S Sheffield St
- 524 Hide Away Lake Loop
- 231 Hide Away Lake Dr
- 240 Hide Away Lake Dr
- 114 Pineneedle Ct
- 0 V L W S Henrietta-3 Acres St Unit 1652107
- 0 W S Henrietta St
- 145 W Woodhaven Dr
- 135 W Woodhaven Dr
- V/L 2 Freebird Estates Clarks Bluff Rd
- 572 Henrietta St
- V/L 436 Seine River Ct
- 322 the Villas Way
- 110 the Villas Way
- 102 Olson Way
- 579 S Arizona St
- 577 S Arizona St
- 509 Hide Away Lake Loop
- 507 Hideaway Lake Loop
- 511 Hide Away Lake Loop
- 511 Hide Away Lake Loop
- 507 Hide Away Lake Loop
- LOT 10 Hideaway Lake Loop
- LOT 105 Hideaway Lake Loop
- LOT 104 Hideaway Lake Loop
- LOT 13 Hideaway Lake Loop
- LOT 14 Hideaway Lake Loop
- 508 Hideaway Lake Loop
- LOT 12 Hideaway Lake Loop
- LOT 11 Hideaway Lake Loop
- 0 Hideaway Lake Loop Unit 7464331
- 0 Hideaway Lake Loop Unit 8843835
- 0 Hideaway Lake Loop Unit 7030615
- 0 Hideaway Lake Loop Unit 9011789
- 0 Hideaway Lake Loop
- 232 S Sheffield St
- 236 S Sheffield St