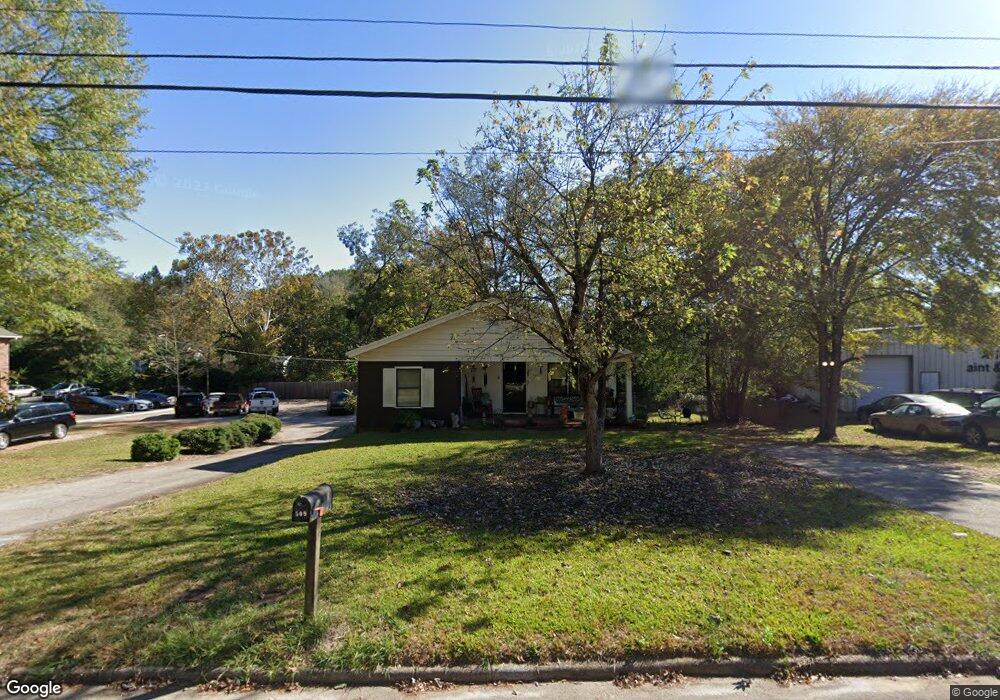
509 Jenkins St Lagrange, GA 30240
Estimated Value: $53,000 - $178,000
2
Beds
1
Bath
888
Sq Ft
$107/Sq Ft
Est. Value
About This Home
This home is located at 509 Jenkins St, Lagrange, GA 30240 and is currently estimated at $94,581, approximately $106 per square foot. 509 Jenkins St is a home located in Troup County with nearby schools including Ethel W. Kight Elementary School, Hollis Hand Elementary School, and Franklin Forest Elementary School.
Ownership History
Date
Name
Owned For
Owner Type
Purchase Details
Closed on
Dec 19, 2008
Sold by
Rennpage Charles
Bought by
Kunkle Timothy P and Kunkle Teresa A
Current Estimated Value
Home Financials for this Owner
Home Financials are based on the most recent Mortgage that was taken out on this home.
Original Mortgage
$13,000
Interest Rate
5.95%
Mortgage Type
New Conventional
Purchase Details
Closed on
Feb 11, 2008
Sold by
Rennpage Charles A
Bought by
Rennpage Charles A
Purchase Details
Closed on
Dec 3, 1998
Sold by
Ussery John
Bought by
Sondra J Rennpage
Purchase Details
Closed on
Jun 30, 1977
Sold by
Light Bryan E and Vera Dee
Bought by
Ussery John
Purchase Details
Closed on
Jan 1, 1973
Sold by
Williams Daryl and Williams Mary L
Bought by
Light Bryan E and Vera Dee
Purchase Details
Closed on
Sep 1, 1967
Sold by
Swanson B P
Bought by
Williams Daryl and Williams Mary L
Create a Home Valuation Report for This Property
The Home Valuation Report is an in-depth analysis detailing your home's value as well as a comparison with similar homes in the area
Purchase History
| Date | Buyer | Sale Price | Title Company |
|---|---|---|---|
| Kunkle Timothy P | $27,000 | -- | |
| Rennpage Charles A | -- | -- | |
| Sondra J Rennpage | $33,000 | -- | |
| Ussery John | $15,000 | -- | |
| Light Bryan E | $10,900 | -- | |
| Williams Daryl | $4,500 | -- |
Source: Public Records
Mortgage History
| Date | Status | Borrower | Loan Amount |
|---|---|---|---|
| Closed | Kunkle Timothy P | $13,000 |
Source: Public Records
Tax History
| Year | Tax Paid | Tax Assessment Tax Assessment Total Assessment is a certain percentage of the fair market value that is determined by local assessors to be the total taxable value of land and additions on the property. | Land | Improvement |
|---|---|---|---|---|
| 2025 | $541 | $23,280 | $2,520 | $20,760 |
| 2024 | $468 | $19,160 | $2,520 | $16,640 |
| 2023 | $408 | $16,960 | $2,520 | $14,440 |
| 2022 | $388 | $15,880 | $2,520 | $13,360 |
| 2021 | $390 | $14,920 | $2,520 | $12,400 |
| 2020 | $390 | $14,920 | $2,520 | $12,400 |
| 2019 | $347 | $13,480 | $2,520 | $10,960 |
| 2018 | $343 | $13,374 | $2,414 | $10,960 |
| 2017 | $343 | $13,374 | $2,414 | $10,960 |
| 2016 | $332 | $13,007 | $2,414 | $10,593 |
| 2015 | $338 | $13,152 | $2,559 | $10,593 |
| 2014 | $321 | $12,594 | $2,559 | $10,036 |
| 2013 | -- | $13,303 | $2,560 | $10,743 |
Source: Public Records
Map
Nearby Homes
- 211 Moores Hill
- 0 Moores Hill
- 202 Parker Ln
- 1520 Brownwood Ave
- 109 Garfield St
- 606 S Lee St
- 507 S Lee St
- 102 Crown St Unit LOT 1
- 613 S Lee St
- 101 Crown St Unit LOT 5
- 517 Jefferson St
- 310 N Lee St
- 0 N Lee St Unit 10550825
- 217 Jefferson St
- 205 Grady St
- 1015 Stonewall St
- 1017 Stonewall St
- 117 Jones St
- 115 Jones St
- 1304 Forrest Ave
- 515 Jenkins St
- 507 Jenkins St
- 1604 Jackson St
- 505 Jenkins St
- 506 Freeman St
- 1602 Jackson St
- 508 Freeman St
- 512 Jenkins St
- 510 Freeman St
- 1600 Jackson St
- 600 Jenkins St
- 502 Freeman St
- 1713 Jackson St Unit 1713B
- 1713 Jackson St Unit 1713A
- 503 Jenkins St
- 102 Clark St
- 602 Jenkins St
- 604 Freeman St Unit 604 B
- 604 Freeman St Unit 604 A
- 521 Freeman St
Your Personal Tour Guide
Ask me questions while you tour the home.