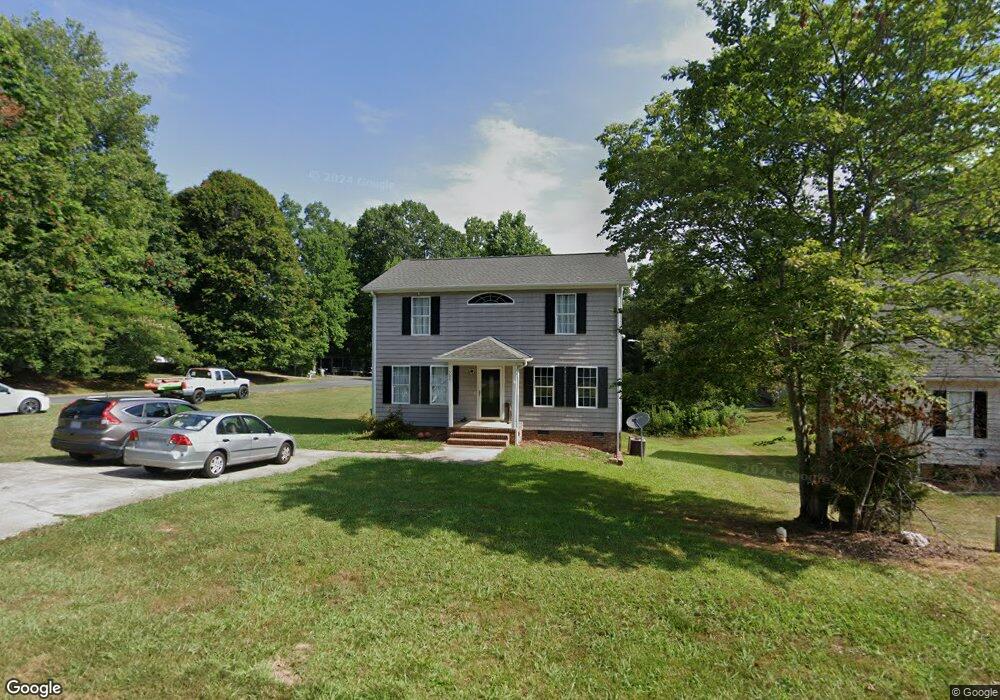
509 Kelly Cir Asheboro, NC 27203
Estimated Value: $235,000 - $280,000
--
Bed
2
Baths
1,498
Sq Ft
$169/Sq Ft
Est. Value
About This Home
This home is located at 509 Kelly Cir, Asheboro, NC 27203 and is currently estimated at $253,131, approximately $168 per square foot. 509 Kelly Cir is a home located in Randolph County with nearby schools including Balfour Elementary School, North Asheboro Middle School, and Asheboro High School.
Ownership History
Date
Name
Owned For
Owner Type
Purchase Details
Closed on
Jun 12, 2024
Sold by
Pappalardo Christopher S and Pappalardo Amy L
Bought by
Christopher Scott Pappalardo Living Trust and Pappalardo
Current Estimated Value
Purchase Details
Closed on
Mar 24, 2022
Sold by
Striblin Eric E and Striblin Stacy L
Bought by
Pappalardo Amy and Pappalardo Christopher
Home Financials for this Owner
Home Financials are based on the most recent Mortgage that was taken out on this home.
Original Mortgage
$132,000
Interest Rate
4.42%
Mortgage Type
New Conventional
Purchase Details
Closed on
Sep 22, 2006
Sold by
Phil Burgess Construction Inc
Bought by
Striblin Eric E and Striblin Stacy L
Home Financials for this Owner
Home Financials are based on the most recent Mortgage that was taken out on this home.
Original Mortgage
$117,000
Interest Rate
9.59%
Mortgage Type
Purchase Money Mortgage
Create a Home Valuation Report for This Property
The Home Valuation Report is an in-depth analysis detailing your home's value as well as a comparison with similar homes in the area
Home Values in the Area
Average Home Value in this Area
Purchase History
| Date | Buyer | Sale Price | Title Company |
|---|---|---|---|
| Christopher Scott Pappalardo Living Trust | -- | None Listed On Document | |
| Pappalardo Amy | $165,000 | Donato Law Pc | |
| Striblin Eric E | $130,000 | None Available |
Source: Public Records
Mortgage History
| Date | Status | Borrower | Loan Amount |
|---|---|---|---|
| Previous Owner | Pappalardo Amy | $132,000 | |
| Previous Owner | Striblin Eric E | $117,000 |
Source: Public Records
Tax History Compared to Growth
Tax History
| Year | Tax Paid | Tax Assessment Tax Assessment Total Assessment is a certain percentage of the fair market value that is determined by local assessors to be the total taxable value of land and additions on the property. | Land | Improvement |
|---|---|---|---|---|
| 2025 | $2,322 | $175,210 | $23,600 | $151,610 |
| 2024 | $2,322 | $175,210 | $23,600 | $151,610 |
| 2023 | $2,322 | $175,210 | $23,600 | $151,610 |
| 2022 | $1,843 | $127,860 | $20,650 | $107,210 |
| 2021 | $1,843 | $127,860 | $20,650 | $107,210 |
| 2020 | $1,843 | $127,860 | $20,650 | $107,210 |
| 2019 | $1,843 | $127,860 | $20,650 | $107,210 |
| 2018 | $1,794 | $122,250 | $16,800 | $105,450 |
| 2016 | $1,794 | $122,245 | $16,800 | $105,445 |
| 2015 | $1,797 | $122,245 | $16,800 | $105,445 |
| 2014 | $1,754 | $122,245 | $16,800 | $105,445 |
Source: Public Records
Map
Nearby Homes
- 503 Sunrise Ave
- 2403 Regency Dr
- 1121 Hub Morris Rd
- 911 Old Liberty Rd
- 2339 Hickory Forest Dr
- 1913 Levance St
- 1907 Levance St
- 1223 Old Liberty Rd
- 728 Central Falls Rd
- 734 Central Falls Rd
- 2048 Heritage Ct
- 1822 Newell St
- 1226 Old Liberty Rd
- 1807 Newell St
- 738 Oak Bend Dr
- 1684 Pen Oak Dr
- 240 Landis Ct Unit 10
- 410 Millikan Dr
- 1847 Saddlewood Ct
- 2539 Windstone Ct